Lots of ETF stuff today.
First, starting last fall, I walked everyone through my test drive of the Defiance NASDAQ 100 Enhanced Options Income Fund (QQQY). It sells 0dte puts on the NASDAQ 100 and generates a huge "dividend." On a price basis, the fund can't keep up with the payout, not even close. It came out last fall at about $20/share and today it is just under $14.00. The total return is a different story.
For however many times I wrote about the fund, I made sure to mention that to own one of these, you need to reinvest most or all of the dividend. A 20% total return for 10 months is pretty good as is, say 15% if an investor took out something close to a normal dividend of 4-5% from the distributions and reinvested the rest.
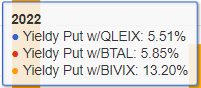
I could see a strategy blending QQQ with QQQY or a similar fund to capture more of the QQQ effect with just a little more yield. I backtested 90% QQQ/10% QQQY, it lagged QQQ slightly. Over the nine month backtest, that combo had a total return of 32.41% and yielded 5.5%. In that instance, I think an investor could rebalance a few shares out of QQQ into QQQY instead of reinvesting QQQY's dividend.
Owning QQQY for five or six months, I reinvested each dividend, my total return was about 10% but the price in nominal terms fell from $20 to just under $16. The reason I am mentioning it today is that Yahoo reported the fund will be doing a 1 for 3 reverse split. There's a negative connotation with reverse splits and being associated with companies that come close to failing but I do not believe reverse splits the way QQQY is doing it is a negative unless an investor is spending the entire payout. If you have any interest in these, I can't stress enough how important it is to reinvest the vast majority of the "dividend" if not the whole thing.
A quick follow up on the VettaFi fixed income webinar I mentioned yesterday. The angle for a bond substitute was the Cullen Enhanced Equity Income ETF (DIVP). I was not able to watch the entire thing. There was actually a program of different topics of which DIVP was one. DIVP looks like it owns value stocks that pay a growing dividend and sells call options. The ETF just started trading in March. There is a mutual fund version with symbol ENHNX that goes back to 2016. The mutual fund website compares the fund to the CBOE BuyWrite Index.

The point I made yesterday is that equity funds, whether they are somehow defensive, high income, value, whatever, should not be expected to be substitutes for what people hope bonds will do. ENHNX fell 11% in the mini-crash at the end of 2018 and in the 2020 Pandemic Crash it fell 30%, both instances were a little better than the S&P 500 but not what I think investors expect from bonds. In 2022 it was up 86 basis points which good of course but also right in line with some other dividend fund including iShares Dividend Select (DVY) that we looked at yesterday that was up 1.91% in 2022. In 2023 ENHNX was up 96 basis points and this year it is up 29 basis points through the end of June.
In terms we talked about yesterday, ENHNX is 1 for 3 as a bond substitute. Is that good enough? It might be a fine fund, I'm not saying otherwise but I would not count on it to be anything other than a lower volatility equity exposure and even then, not always.
The real hook for the VettaFi event was Nancy Davis who runs the Quadratic Interest Rate Volatility & Inflation Hedge ETF (IVOL). I missed her part but can catch the replay when that gets emailed out. I was able to get a whitepaper about the fund that I dove in on. It's a complex strategy with a lot of moving parts. It has pretty solid AUM of $651 million but I am pretty sure it was over $1 billion at one point.
It did very well in 2020 but other than that it has struggled. The oversimplified explanation of what it does is that owns TIPS via the Schwab US TIPS ETF (SCHP) and options such that it benefits from bond market volatility. SCHP has an effective duration of 6.5 years.
The following table paints a great picture of what environments are likely to be tailwinds for the fund and headwinds.
The whitepaper then goes on to position why the various, potential tailwinds could soon be coming into play. We've had plenty of interest rate volatility over the last few years as measured by the MOVE Index and the fund has struggled so maybe that one is less important. We know in 2020 that interest rates at the front end went down because of the Pandemic. SCHP went up almost 10% in 2020 which was more about rates dropping (bond prices up) as opposed to TIPS par value adjustments because the Pandemic was more deflationary than inflationary. The CPI was up 1.2% in 2020. Interest rates went down in 2020, the US Ten Year Treasury went from 1.83% to 1.11%.
The whitepaper suggests that if you want to add IVOL to you portfolio that you consider it as a replacement for part of exposure to AGG or TIPS.
There's no differentiation looking back. I guess if the curve steepens meaningfully, IVOL will outperform but that isn't clear to me. I don't have perfect understanding of IVOL by any means but one conclusion I draw is that there is not a direct cause and effect between the inputs and how the fund will perform. For example, a simple inverse index fund is a direct cause and effect. If the S&P 500 drops 1% today, the inverse will go up 1%, direct cause and effect, you know what you're getting. Client and personal holding BTAL is one step removed from that direct effect. It's almost as certain as an inverse fund. A fund that goes long the VIX index is pretty reliable but I believe less reliable than BTAL. I'm describing a scale or a spectrum.
Not every alternative I use is at the same point on this scale of reliability but I think there needs to be some basis to believe the fund will be additive in some way. Something with a negative correlation is additive. Something that goes up slightly, no matter what is additive. Something that does it's own thing but generally makes it's way higher (I think this describes most of the AQR funds) is additive. I am not seeing it with IVOL. It seems like it could have a couple of the top down tailwinds happening and still the fund might not do well. It's like one or two variables removed from "working." Whatever an investor might hope to accomplish with IVOL can probably be found with a more reliable strategy/fund. Please leave a comment if you draw a different conclusion.
Last one, the Simplify Volatility Premium ETF (SVOL) got a 5 Star rating from Morningstar. I don't think I've ever looked at the fund but maybe I'm missing something. There's a 13 minute video to watch to learn about the fund. It has more going on under the hood than IVOL. I'd say it really is a hedge fund of sorts. It has about 30% in Simplify's own fixed income ETFs which each have their own complexities. SVOL also shorts VIX to capture between 2/10's and 3/10's of the VIX' movements. It does this by shorting VIX futures and hedging that exposure with long VIX calls. It also blends in S&P 500 options, mostly long puts, short some T-bond futures and owns some T-bills.
The VIX seems to be the main thing but embedded into the VIX strategy is a carry strategy, there's that word again, to take advantage of the VIX futures term structure. The fund gives off a good amount of income as well.
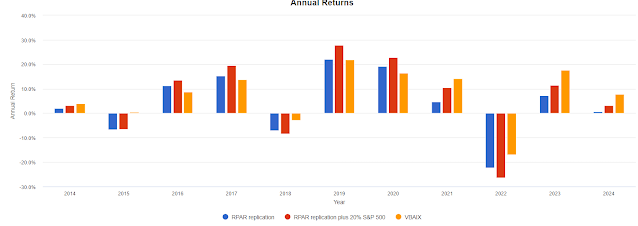
Simplify suggests making room for SVOL in the equity sleeve of the portfolio. So let's model that out.
Not much differentiation. Using 10% SVOL offered a little improvement in 2022, you can decide if you think that was meaningful. One other thing to point out is that it pays out a big "yield." The backtest shows total return. On a price basis it is down from $25.75 when it first started trading to $22.30 at the close on Thursday. Portfoliovisualizer says the correlation of SVOL to the Vanguard S&P 500 ETF is 0.82 which is high. They're saying it is an equity proxy and that seems to be true.
Comparing them one on one is interesting though.
There is some differentiation there. SVOL has a much lower standard deviation on the way to an identical return through the end of June. The portfolio above with 10% in SVOL, I reran it with 20% to SVOL and just 40% to VOO. The difference in CAGRs was one basis point but the standard deviation for 20/40/40 was 158 basis points lower and in 2022 the 20/40/40 blend outperformed straight 60/40 by 297 basis points.
I feel like we've looked at countless other ways that do a better job than SVOL to create a more robust portfolio. Additionally, SVOL is very complex, there are a lot of things under the hood that can go wrong. Some of the other alts we've looked at have shown that smaller allocations have a greater observable impact on the portfolio than even 20% to SVOL. At 0.82 correlation to VOO, SVOL is not a differentiated return stream to the extent we've looked at in previous posts.
The information, analysis and opinions expressed herein reflect our judgment and opinions as of the date of writing and are subject to change at any time without notice. They are not intended to constitute legal, tax, securities or investment advice or a recommended course of action in any given situation.