Showing posts sorted by date for query cockroach. Sort by relevance Show all posts

Tuesday, April 14, 2026

"The Cost Of Being Different"

Morningstar has an article up about the importance of diversification but warns about over diversifying. Here's the money quote from author Amy Arnott. "In my opinion, most investors need exposure to three core asset classes: US stocks, international stocks, and investment-grade bonds." She adds that some people might want TIPS exposure too. 


Over the long term, both portfolios (note I did not see suggested weightings beyond 60/40) compounded just fine at 7.17% and 7.59% respectively. Those numbers, combined with an adequate savings rate will get it done.

But neither version offers any real diversification. They track the market, they are the market, they don't differentiate from the market at all. Put differently, what is it the Morningstar thinks is being diversified away? If someone just went 100% SPY at the start of this back test, they'd have had larger drawdowns every time on the way to a higher growth rate; no differentiation, just bigger swings. 

The notion of overdiversification is worth raising though. I think we explore that here by try to keep things simple, relatively simple or in trying to allocate more heavily to simplicity versus complexity. A lot of the portfolio construction ideas we pull in to blog about flirt with overdiversification. The Cockroach Portfolio might be a tad busy, so too is some of the work the ReturnStacked guys do with their model portfolios and there are others. But we can learn from all of them. 

That brings us to a paper from ReturnStacked titled "What Is The Optimal Stack?" The focus seems to be trying to create a portfolio that has the same volatility as plain vanilla 60/40 but improve on every other metric. The real answer from them was a very levered up split with 24% to equities, 71% to bonds, 7% gold, 55% merger arb and 39% managed futures. They had a funny bit about how unworkable that is in real life. I spent some time trying to recreate it such that it had a volatility the same as 60/40 but I couldn't get there. 

Corey Hoffstein Tweeted out this image that was not in the paper. I think it was an output from their new optimizer tool.


I tried several different things with this blend.


Note that you have to be comfortable with AGG-like exposure to actually implement any of these. I am not but I am pretty sure the ReturnStacked guys are. 


All three are better in terms of CAGR and the volatility of Portfolios 1 and 3 are almost identical to VBAIX but I think the way in which they all went down much less in 2022 adds a favorable skew. In the other drawdowns, they don't look much different. 

If you really want to diversify, they say there will be an "expected cost of being different" which is a great line. Just about every backtest you can run that has a large weighting to managed futures looks fantastic but the "cost of being different" is that there can be long periods where it underperforms. Ditto gold. Do you like merger arb? I certainly do but a very strong year for merger arb might be up 7% which looks paltry compared to a strong year for equities. 

We could create more differentiation by including exposure to negatively correlated assets that are more immediately reactive to market declines as we've done in dozens of posts. Using those types of strategies pretty reliably creates a much smoother long term result but can be difficult in shorter periods, that is the "cost of being different," frustration in the short term. 

When you really invest the time to understand how something like managed futures actually works, it becomes much easier to hold on during that frustration. 

The information, analysis and opinions expressed herein reflect our judgment and opinions as of the date of writing and are subject to change at any time without notice. They are not intended to constitute legal, tax, securities or investment advice or a recommended course of action in any given situation.

Thursday, April 02, 2026

Blue Owl Keeps Going Down

Let's continue with some followups to previous posts but also some broad market dynamics too. 

It keeps getting worse for Blue Owl (OWL). The other alt investment firms appear to be in sideways patterns after enduring what thus far have been less severe declines. There is an ETF that tracks these with symbol AAUM which is down 22% YTD.


Obviously the private asset space was showing signs of trouble before the war in Iran started. It's not clear to me that the war is making it worse is making in terms of demand for withdrawals from funds that don't offer daily liquidity. That seems like a market event versus the war being a geopolitical event.

We've looked at these stocks before. They are obvious proxies for the space. We isolated that during the good times and it is apparent during the rough times too. Similar to tech, the group tends to outperform on the way up and go down more on the way down. There's a sort of capital efficient or barbell aspect to it. A small allocation to something with these attributes when sized correctly can provide a return similar to a full allocation to equities but the drawback is periods like now. Forgetting Blue Owl, a 25% drop from a smaller equity allocation might be emotionally difficult to endure when the broad market is down much less. Sized correctly, the dollar impact would be the same but still tough to endure. 

Here are four more portfolios we built for random blog posts that I wanted to circle back to.


The first one is the Cockroach Portfolio that we've looked at many times, this latest version was November of 2025 where the title of the post was I Cracked The Cockroach! Maybe! I can't find a link to the post about the portfolio I labeled Asness Factor Blend but it was in the folder on my computer where I keep all these portfolios we blog about. No dice on the HEQT/Managed Futures post either. Here's the link to the post about the 75/50 portfolio


All the portfolios did much better than 60/40 in 2022 which was due to avoiding duration and adding managed futures. I don't feel that I am cherry picking because I actually did that for clients that year. The Asness Factor portfolio is of course quite the standout. I'm not sure why I used the AQR Market Neutral (QMNIX) back then because despite the name it has had some monster up years that may not repeatable. If they are repeatable then I wouldn't think of it as market neutral despite the name.


Redoing that portfolio to use more of a real market neutral/absolute return proxy, the results are still compelling versus VBAIX and more inline with the others. 

The 75/50 portfolio was too conservative, it captured less than 75% of the upside of the S&P 500, more like half and it went down a lot less than half the S&P. It did quite a better than VBAIX but again, that is attributable to avoiding duration and owning managed futures. While I think duration will be a bad place to be going forward, if that sentiment ends up being incorrect then these portfolios will probably look a lot like VBAIX, not outperform. 

ReturnStacked updated its model portfolios and I wanted to review a couple of them, Structural Alpha Growth which is sort of an 80/20 and Structural Alpha Moderate which is like 60/40. What I did for these is build them exactly as the appear on the website. The models are leveraged using their capital efficient funds, the models leverage up 25-30%. The way they do this is if they allocate 10% to RSST in the model, that adds 10% of domestic equities and 10% of managed futures. It's probably not ok to share the holding and weightings as they posted them, you can create a userid and password and access them yourself. 

The unleveraged versions are mathematically true to the originals, just scaled down.

My version of their 80/20;

And 60/40;


It is very rare if ever where I see the leveraged products actually making it better. Part of it might be their willingness to have AGG-like bond exposure but that doesn't account for all of it. 

The concept is clearly valid so maybe the fund category needs to evolve more. I do think the idea of doubling up the volatility which only a couple of funds do at this point (meaning they target volatility not twice the daily return), could be a better path to capital efficiency via exchange traded products. 

The information, analysis and opinions expressed herein reflect our judgment and opinions as of the date of writing and are subject to change at any time without notice. They are not intended to constitute legal, tax, securities or investment advice or a recommended course of action in any given situation. 

Wednesday, March 12, 2025

Four Quadrant Portfolio Check Up

Let's dig in some more on Permanent Portfolio quadrant style. We took a shorter look on February 25 but with the market's deterioration since, it's a good time to revisit as well as continue this week's theme of learning from the current stress test. 

Below compares the Cambria Trinity ETF (TRTY) which is quadrant-ish and does some interesting things allocation-wise. AQR Multi-Asset (AQRIX) used to be called Risk Parity and it also does some quadranty stuff. PRPFX is the inspiration for all of these so of course we're including that one. Next is the allocation for the United States Sovereign Wealth Fund ETF that I made up a few days ago and next to that is my most recent attempt from November to recreate the Cockroach Portfolio which is managed by Mutiny Funds.


First the longer term result as far back as it can go.


For the same period, the Vanguard Balanced Index Fund (VBAIX) had a growth rate of 8.37% and volatility was 10.87%. The max drawdowns of the backtested portfolios bottomed out in late 2022 as follows


To the extent quadrant style might intersect with all-weather, you can decide for yourself whether any of them were all weather enough. There's no wrong conclusion to draw, do you think they are all-weather enough? AQRIX obviously was hit the hardest in 2022 which makes sense from the standpoint of it being a risk parity strategy but the Risk Parity ETF (RPAR) was down 29% at that same point. RPAR is indexed and I think that fund's result shows that risk parity doesn't lend itself to an indexed approach. 

TRTY is a tough hold. It's growth rate since inception is 3.58% going back to September, 2018 but a lot of that comes from a 15% lift in 2021 (numbers per testfol.io). If the volatility was very low then the tradeoff might be more attractive. It had a big drawdown in the 2020 Pandemic Crash which, ok, something like that sure but it had a surprisingly big drawdown in 2022 as you can see at 13%.

PRPFX has a higher growth rate with less volatility than VBAIX over a very long time horizon. That is very likely, the quadrant style on full display, with gold and cash proxies allowing it to have much smaller drawdowns in most, not all, adverse market events. 

The United States Sovereign Wealth Fund ETF that I made up is primarily designed to be counter cyclical, that is to have very little equity beta and a low standard deviation which it does. If I actually made this an ETF (I'm open to the idea if anyone from a white label is reading this), it would be a diversifier, maybe in the realm of absolute return although the CAGR and standard deviation might be a little higher than most funds in that category. I would say, that if the United States Sovereign Wealth Fund ETF that I made up is best performer in a portfolio, then maybe things in the world aren't going so well. 

And finally, the Cockroach Portfolio replication. That is a very specialized type of result. I think it is important to be willing to have your portfolio really differentiate at times and this one seems to differentiate all the time. I took out TRTY and AQRIX and added VOO and VBAIX to show how differentiated Cockroach, or at least my attempt to replicate it, has been.


The lower growth rate with lower volatility can absolutely be appropriate for some investors. If someone is legitimately ahead of the game or maybe has income streams beyond their portfolio and Social Security then a CPIplus sort of return, which might be a good way to think about the Cockroach replication, is valid. 

Back to the top and what we are learning, if anything, from the current stress test.

  • VOO down 4.32% YTD through yesterday
  • VBAIX down 1.92% YTD
  • TRTY down 5 basis points
  • AQRIX up 2.01%
  • United States Sovereign Wealth Fund ETF that I made up +2.31%
  • Cockroach Replication up 4.34%.

I'm obviously going to conclude that alternatives in suitably small doses and some degree of differentiation are crucial for longer term investing success. Differentiation is good when you want it, challenging when you don't.

The information, analysis and opinions expressed herein reflect our judgment and opinions as of the date of writing and are subject to change at any time without notice. They are not intended to constitute legal, tax, securities or investment advice or a recommended course of action in any given situation.

Monday, December 09, 2024

An Updated Permanent Portfolio

Earlier on Monday I look at a couple of different proxies for the Permanent Portfolio. The big idea as we've talked about here many times is that it equal weights stocks, long bonds, gold and cash at 25% each so that no matter what is going on in the world, at least one of the four is holding up well. There is a mutual fund by that name with symbol PRPFX and the concept inspires many of the portfolios we study here like the Cockroach Portfolio by Mutiny Funds.

I wanted to take a stab at trying to improve the long term result of the Permanent Portfolio which are pretty good. Portfolio 1 is 25% each to Invesco S&P 500 Momentum (SPMO), Stone Ridge Hi Yield Reinsurance (SHRIX) which is Cat bonds, SPDR Gold Trust (GLD) and Campbell Systematic Macro (EBSIX) for managed futures. 


The asymmetry modeled into Portfolio 2 is Nvidia. The idea is not to imply I can pick something that goes to the moon but to understand the impact if you can pick something and get it right. The portfolios do not rebalance in the back test to show the impact of asymmetry working. If something chosen for it's asymmetry goes to zero then the math doesn't cause too many problems, just a small drag, at least early on. If from here, Nvidia went to zero, the impact would be meaningful but wouldn't be worse off from the starting point in a meaningful way.

In addition to the data in the screen grab, Portfolio 1 has the best Calmar Ratio with Portfolio 2 close behind and Portfolio 1 had far and away the best Kurtosis. In 2022, Portfolio 1 was flat, Portfolio 2 was down 10% which speaks to the impact of NVDA going down 50% that year, PRPFX was down 5% and VBAIX was down 17%. 

As we said in yesterday's blog post, any sort of real world application of this wouldn't have to be limited to four or five holdings. SPMO could be replaced with a broader mix of ETFs and single stocks, one managed futures fund could be replaced by a couple or maybe add in other second responder type defensives, there are plenty of strategies with similar volatility profiles as SHRIX to diversify that sleeve and maybe the gold could be combined with some broader commodity exposure. 

The information, analysis and opinions expressed herein reflect our judgment and opinions as of the date of writing and are subject to change at any time without notice. They are not intended to constitute legal, tax, securities or investment advice or a recommended course of action in any given situation.

Wednesday, November 27, 2024

I Cracked The Cockroach! Maybe!

We've had a lot of fun over the last year or two looking at the Cockroach Portfolio run by Jason Buck and Mutiny Funds. It is Permanent Portfolio inspired. Where the Permanent Portfolio allocates 25% equal portions to stocks, long bonds, cash and gold with the goal of having at least one of the four going up at all times, the Cockroach Portfolio allocates as follows.

We haven't had much luck trying to replicate it thus far but as I was listening to Jason on some podcast recently I had some further thoughts on how to get to something useful for investors. Part of the reason it has been difficult to replicate is that ETFs and mutual funds we'd have access to are probably not as good as the myriad of managers that Mutiny can access to add into the Cockroach. And there are a couple of sleeves that probably can't be accessed at all.

Using the word replication may not be precisely correct, the objective with these sorts of posts is to take what by all accounts is a successful asset allocation strategy and see if there is a way to apply some of the principles even if we can't nail down short versus medium versus long trend. 

Back in June we built out the following in an attempt to replicate it as closely as possible. 


The actual Cockroach Portfolio is leveraged but I reduced the weightings down proportionately to take the leverage out as follows. Below is the updated attempt at replicating the strategy.


There are some changes compared to what we did in June. The equity exposure shifted to momentum from market cap weighted. Relative value can be expressed as a form of long/short that seeks outperformance as opposed to arbitrage or market neutral so I added QLEIX. I used client holding CBOE as a proxy for long volatility. It takes on some attributes of VIX when the market goes down along the lines of if VIX goes up 5% in reaction to something, CBOE might go up some fraction of 5% (casual observation).

Client and personal holding ASFYX has a shorter trend overlay on top of the more normal 200 day/10 month trend and I added EBSIX for a little diversification and that is a name we use regularly for blogging purposes. With TFLO and client holding BKLN, we are taking duration out of the fixed income sleeve more in line with my thoughts. 


The June version doesn't keep up with the November version, PRPFX or VBAIX but it was down the least in 2022 and has the lowest standard deviation. The November version was the best performer and the standard deviation looks good too, probably thanks to removing the terrible run that bonds with duration had along with the volatility that space has taken on. Both the June and November versions handled the 2020 Pandemic Crash much better than PRPFX and VBAIX and as I mentioned, they did better in 2022. The Calmar numbers are surprising at 0.80 for the June version, 2.60 for the November version, 0.66 for PRPFX and 0.17 for VBAIX. Higher is better for Calmar.


The portfolio names here self explanatory. Where Cockroach views Bitcoin as a hedge against some sort of bad outcome with fiat currencies, I'm changing the idea to be about asymmetry. Bitcoin has an obvious asymmetric outcome, it could go up a ton or crap out entirely. Portfolio 1 then has no asymmetry, the gold plus Bitcoin sleeve in the actual Cockroach is entirely allocated to gold. Portfolio 2 is what we looked at above (I don't know why the CAGR and the other data points are different) and Portfolio 3 uses client holding Novo Nordisk (NVO) which has turned out to deliver a different type of asymmetric return.

I did it this way so that you can decide whether you think asymmetric exposure is worth adding or not. Yes, NVO is cherry picked but that is not about looking forward but a different look at what getting asymmetry right can add to a portfolio. Of course, something with asymmetric potential could fail miserably. Maybe along the lines of Taleb, someone believing in adding asymmetric opportunities would split up the 4.15% we're assuming for this blog post. 

The November version has some compelling attributes and is far more realistic than any other versions we've played around with. One thing that could hold it back is it really only has 33%+/- in equities, the two momentum ETFs, CBOE and QLEIX sort of. In the last ten years, QLEIX has looked somewhat similar to equities five times and looked very different the other five. It is also worth mentioning that of the years available to backtest, the November version only was the best performer of the four, one time. The long term result has been valid but year to year it might have been difficult to sit with. 

Please leave a comment if you have a different angle to construct this idea.

The information, analysis and opinions expressed herein reflect our judgment and opinions as of the date of writing and are subject to change at any time without notice. They are not intended to constitute legal, tax, securities or investment advice or a recommended course of action in any given situation.

Sunday, September 29, 2024

Trying To Learn From Risk Parity

This is going to be fun thanks to a research paper by Long Tail Alpha that looks at several permutations of risk parity by reducing or replacing bonds with trend following/managed futures. 

Risk parity equal weights assets by their risk (more like their volatility). Where stocks are far more volatile than bonds (usually), a risk parity program would have to own far more in bonds to equal out the volatility between the two assets. It takes so much more exposure to bonds that it needs to use leverage to get the weighting right. The paper tested several variations of risk parity and using just stocks and bonds, the weightings they used were 78% in stocks and 333% in bonds to give some idea of the leverage. The backtest with stocks, bonds and commodities weighed out at 59%, 282% and 41% respectively. The leverage is usually obtained by using treasury futures. 

There are a few funds that offer one version or another of risk parity; Fidelity Risk Parity Fund (FAPYX) which started trading in 2022, the indexed Risk Parity ETF (RPAR) which started trading in 2020, the Ultra Risk Parity ETF (UPAR) which is a levered up version of RPAR, Wealthfront Risk Parity (WFRPX) and the AQR Multi-Asset Fund (AQRIX) which used to be AQR Risk Parity but does do things with leverage that resembles risk parity. Actually quite a few AQR funds do this. 

One point made in the paper was that running a risk parity program requires regularly (constantly?) reassessing the risk/volatility of the assets held and reweighting accordingly. This makes sense. Look at the 78/333 blend. It seems like there'd be a lot of leeway to make changes if stocks fell 20% over the next two weeks. In that sort of instance it might make a lot of sense to ratchet up the equity exposure either by buying more stocks, selling down the fixed income or both. 

"Risk parity portfolios are particularly vulnerable when their active weighting algorithms fail to predict shifts in asset correlations." If the paper is correct about the need to do this, it undercuts the premise for indexing risk parity which is what RPAR and UPAR do. As index funds, presumably there is no sort of algo assessing correlations or anything else. RPAR has underwhelmed just about every time we have looked at it. 

The authors noted that risk parity did very well for a long time but that "bond based risk-parity failed miserably in 2022." In fund form, it started doing badly long before 2022 which is corroborated by AQR's change to AQRIX in 2019. It had been struggling for a while at that point and so they changed it. 


The table/chart goes back to FAPYX' inception. In the same period Vanguard Balanced Index Fund (VBAIX) which is a proxy for a 60/40 portfolio compounded at 10.89% with a standard deviation of 12.43%. AQRIX has some risk parity attributes but maybe it doesn't really belong? Either way  FAPYX, RPAR and WFRPX are all tough sells. This year they are doing a little better price-wise with indexed RPAR bringing up the rear with a 5% gain through August. 

Just because the investment case for the funds is weak doesn't mean we can't learn from the risk parity paper. Here are some stats adding trend to stocks and bonds in a risk parity program weighted at 67% equities, 268% bonds and 63% in trend versus the 78/333 blend for stocks/bonds we mentioned above.


Stocks/bonds/trend also had a much lower kurtosis. Kurtosis is a very fancy word where the higher the number, the greater the risk of an outlier result like 2022. A lower number is a mathematical representation of smoothing out the ride via fewer/smaller outlier results. They also compared stocks combined with bonds to stocks combined with just trend (no bonds) and stocks/bonds did much better which is surprising. That is explained by the terrific run in bonds for most of the period studied. I have been contending for a couple of years, all that was good about bonds with duration is now gone. 

Then the paper looked at what it called optimized trend which is a combination of trend (managed futures) and carry. We've spent some time trying to figure out carry as ReturnStacked implements it and the paper gives what might be a more useful idea. Trend will go long markets like commodities and currencies and so on that are in favorable trends and sell short markets in unfavorable trends. Weaving carry in to optimize trend limits the strategy to going long markets in favorable trends and with a favorable roll yield aka positive carry aka backwardation. To short a market in an unfavorable trend that market would also have to be in contango, have a negative carry. That gave improved results as shown here.


Surprisingly though, the kurtosis was inferior to stocks/bonds/plain vanilla trend. The weightings for this model were 64%, 251% and 54% to optimized trend. Finally they work commodities in and the result appears to be better leaving commodities out.


Note that the kurtosis of this blend is a a fair bit higher with commodities included. And the weightings to this last one were 51%, 225%. 35% to commodities and 46% to optimized trend.

I am not aware of a managed futures fund that adds in carry in the manner discussed above. I spent some time looking but didn't make a day of it. If you know of one, please leave a comment. 

The manner in which leverage was used in the paper is not accessible to retail sized investors in brokerage accounts which is fine with me. Many terrible market episodes have been caused by misusing leverage and while I am sure risk parity and the like is "different" (I am being sarcastic and snarky)....there can be a use for some leverage in a diversified portfolio like a sub 10% portfolio weighting in a fund that uses leverage. Such a fund is unlikely to end in financial catastrophe even if the fund in question blows up. That is a far cry from 333% in bonds. 

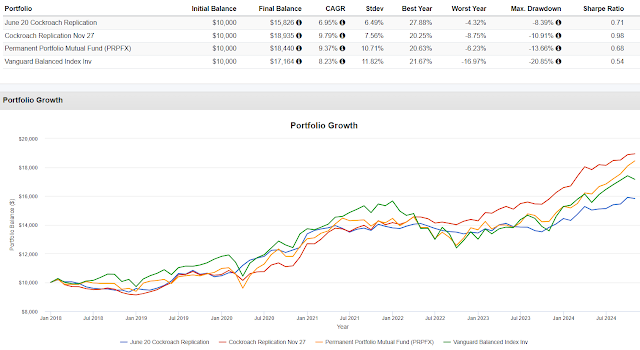
Where true risk parity is out (for me anyway) and I'm not seeing with the funds, the question is whether some attributes of risk parity can work into a diversified portfolio to make it more robust? Again, the leverage used in the paper isn't accessible so I built the following to replicate RPAR. I'm not using RPAR yet because this replication allows us to go back much further than how long RPAR has been trading. The math is only off by a shade using leverage via UST and a little bit of SSO, remember RPAR is leveraged.


Taking the idea from the paper of swapping in managed futures or reducing it, I built the following.


Portfolio 2 splits the duration sleeve of RPAR with half in managed futures and half in catastrophe bonds which provide income without really taking duration risk. Portfolio 3 puts the entire duration sleeve into managed futures. Both Portfolios 2 and 3 are reduced proportionally to take leverage out.


Splitting the duration into catastrophe and trend had slightly better growth, a considerably lower standard deviation and much better Sharpe Ratio. This is probably attributable to trend having some weak years in the 2010's. The CAGR and volatility strikes me as something you might shoot for with a strategy like the Cockroach Portfolio that we've looked at many times or maybe what the Cambria Trinity ETF (TRTY) is trying to do. Both 2 and 3 were up in 2022 while the RPAR replication was down 11%. 

I find this to be interesting but anyone needing normal stock market growth in order for their retirement plan to work, probably isn't going to get it from any of these portfolios. 

The next table adds the actual RPAR in as the benchmark which shortens the time frame and the output is puzzling. In the replication of Portfolio 1, I tried to avoid any sort of qualitative improvement to get a better result. 

The Replication is based on this from RPAR.


In 2020, RPAR did much better than the replication, did a little worse in 2021, 2023 and 2024 YTD and in 2022 RPAR lagged the replication by 11%. If you see an error on my part please leave a comment. 

I've been studying risk parity for a long time. The idea is very intriguing, volatility weighting different asset classes even though the parity part of trying to equal weight the volatility is not something I believe in doing. A portfolio that equal weights assets' volatility is not going to have a normalish weighting to equities which I think is important for most investors. Normalish is a wide range, 40-70% maybe, well 40% might be a little light but you get the idea. 

The volatility and correlation characteristics of the alternatives we talk about regularly here can help solve the issue of equity volatility management. I'm sure it's obvious that is where I am coming from, I write about it almost every day. One concept from way back that we talk about here is taking bits of process from various sources to build your own process. The above probably captures the little bit that risk parity contributes to my process. Portfolios I manage don't really look anything like risk parity but there is influence. 

And since I mentioned TRTY above, here that fund is with the same Portfolio 2 both compared to VBAIX.


The information, analysis and opinions expressed herein reflect our judgment and opinions as of the date of writing and are subject to change at any time without notice. They are not intended to constitute legal, tax, securities or investment advice or a recommended course of action in any given situation. 

Saturday, September 07, 2024

Defense Without Bonds

In 2022 we wrote a couple of posts about the Dragon Portfolio which an interesting idea inspired by the Permanent Portfolio which allocates 25% each to stocks, long bonds, cash and gold. Dragon is similar to the Cockroach Portfolio in that it is offered at a high minimum to sophisticated investors. Maybe. As I look at the Dragon website, pages are not populating correctly and I found some hits on Google that talked about outflows due to poor performance. I don't know what is going on but when we looked at it two years ago, our attempts to replicate it resulted in a CAGR below two. It can still be interesting to study and after two years could the allocation have started to pay off?

  • Equities 24%
  • Long Volatility 21%
  • Gold 19%
  • Bonds 18%
  • Commodity Trend 18%

This is how I tried to replicate it in 2022


Keep in mind that, like Cockroach, anything we might do with ETFs and mutual fund won't really capture what the actual fund can access to include in its portfolio. It's more like, the asset allocation idea is interesting, is there a way to get close? Whatever Dragon does/did, it's a good bet it is using a manager(s) that gets a result for long volatility that is much better than the manner in which VIXM bleeds. A small allocation to VIXM can be effective but 21% is a huge weight to something that goes down very frequently.

The last couple of years though improved the results slightly, the CAGR got above 2%.

Dragon was a decent place to hide in 2022 dropping about half as much is VBAIX but in 2023 it had literally no upcapture. While I am certain that the volatility sleeve was better than our backtest with VIXM, if the fund had trouble with poor returns, that huge of a weighting to long volatility is the first place I would look. 

I like the phrase too clever by half, I've used it here several times and some of these portfolios we look at seem like they could be too clever by half to actually implement but I would double down on the idea that studying them is beneficial. I used TLT which seems like a reasonable proxy for long bonds but that fund is down 50% from its all time high. Removing that money loser in favor of one of the floating rate funds we use for blogging would help the result as would greatly reducing the allocation to VIXM and putting that into equities.


Now Portfolio 2 has more equities, less VIXM and owns TFLO instead of TLT. The CAGR came up quite a bit, it still doesn't look too much like 60/40 for growth but the standard deviation is very low, lower than our attempt to replicate the Dragon Portfolio and the portfolio stats look better. When tinkering with these things, don't be afraid to have a normal-ish allocation to equities. 25% in stocks means having to get a lot of growth out of other asset classes that probably not as growthy. 

All of that is a preamble to today's post. Blogger Nomadic Samuel is do-it-yourself investor who writes a lot of very fun posts about some thought portfolio ideas that are very highly leveraged. While I think all the leverage is a Black Swan waiting to happen, it's still fun. He has a portfolio he calls The Sloth which he says is Dragon Inspired. 

He is big on the ReturnStacked Fund suite but they are all so new that backtesting with them doesn't tell us much but we can replicate them on Portfoliovisualizer and still capture the leverage. First up is the allocation of The Sloth.


BTAL is a client and personal holding. TAIL is the newest fund but goes back to 2017 so we get a decent backtest. Portfolio 2 is the same allocation but reduced proportionally to cut out the leverage so ACWI has an 18.75% weight, TAIL is 9.375% and so on. For Portfolio 3 (Roger's Version), I built the following.


It's a tweak on The Sloth but no bonds, less to TAIL and BTAL with more to equities. It's still not a normal allocation to equities but that's ok. 

None of them keep up with VBAIX' growth rate but the Sloth and my version are kind of close. The standard deviation to my version is about half that of VBAIX. The 2022 results are interesting.


You can decide for yourself whether there is any validity to any of this. The idea from me was to create a similar result without the added layer of risk from so much leverage as well as avoiding bond duration. The result from my version is not so far off that I'd conclude NFW like I would from the Dragon Portfolio, there's NFW with that one. My version is yet another example where the defense that people hope to get from bonds can be had without taking on what has become unreliable, equity-like volatility that now exists in the bond market. And repeating for emphasis, twenty something percent in something like tail risk or long VIX should be expected to create a huge drag on a portfolio. 

The information, analysis and opinions expressed herein reflect our judgment and opinions as of the date of writing and are subject to change at any time without notice. They are not intended to constitute legal, tax, securities or investment advice or a recommended course of action in any given situation.

Sunday, September 01, 2024

Mimicking Allocation, Not Constituency

Following up on yesterday's post, I thought of a way articulate the way in which we deconstruct sophisticated portfolios like the Permanent Portfolio, the Cockroach Portfolio or in the case of yesterday's post, the Trinity Portfolio. Click through to yesterday's post if you want more context.

The idea is to study the allocation, not the constituents. Look through at the various Trinity links from yesterday, you'll see the ETF and the SMAs have a lot of holdings. The Cambria Trinity ETF (TRTY) shows 27 different ETF holdings plus two cash proxies. That seems like a lot of ETFs for a fund of funds. In the real world, the portfolio I manage for clients includes a lot of individual stocks and 27 is in the neighborhood of how many names I hold on the equity side of the ledger. 

That sort of portfolio constituency seems very complex to me. What do you think Trinity, or one you might be more interested in, is trying to do? I think Trinity is trying to smooth our the ride versus a typical 60/40 portfolio but still get some upside participation.


Ok, it smooths out the ride but I think there are way to get a similar volatility profile but with a little more upcapture, using Trinity's allocation weightings. 


Let's look at Trinity 3 since we did not look at that one yesterday. According to the Trinity performance data, from Nov 2016-March-2024, Trinity 3 compounded at 5.08% with a standard deviation of 8.61% and a max drawdown of 15.59%. Here are two much simpler versions of Trinity 3, one with AGG for the fixed income proxy and one with floating rate as the income proxy as follows. 


As we talked about yesterday, it looks like trend is comprised of some sort of actively managed split between managed futures and momentum equities. I used ACWI instead of and S&P 500 fund because I believe that makes for a fairer comparison to Trinity 3.


Portfolio 3 is simply the Vanguard Balanced Index Fund (VBAIX) which is a proxy for 60/40. Portfolios 1 and 2 have a lot less equity exposure than VBAIX and a chunk of that is in foreign which has lagged domestic. Neither version of Trinity we made is likely to keep up performance-wise but it is a lot closer for the same period as the more complicated, actual Trinity 3. Both the AGG version and the TFLO version actually end up with a lower standard deviation than Trinity 3. The Trinity performance page shows the max drawdown for Trinity 3 at 15.59% but I am not sure if that was in 2022 or not. The AGG version was down 2.90% in 2022 and the TFLO version was up 2.05% that year. FWIW, the Trinity ETF was down 3.32%. 

I think there is something to the Trinity allocation but not the constituency or what I perceive as complexity. The tradeoff though is that in some years, like 2023, the AGG version and the TFLO version could get left way behind, they were up about half as much is VBAIX last year. 

The information, analysis and opinions expressed herein reflect our judgment and opinions as of the date of writing and are subject to change at any time without notice. They are not intended to constitute legal, tax, securities or investment advice or a recommended course of action in any given situation.

Sunday, August 25, 2024

Don't Rely Solely On Backtesting

The only place talking about the strategy known as carry has been the ReturnStacked guys. That might be a slight exaggeration and I did find someone else talking about it, a short paper by Campbell & Company. The explanations of what carry tend to be complicated but I think I can distill it to be simpler even if it is too simplistic. 

There is the version where carry is the return just by holding an asset like the dividend from stock or the interest from the bond. There is the carry trade where you borrow or sell short a low yielding currency and buy a high yielding currency and make the difference between the interest paid on the borrowed currency and the interest earned on the currency that was bought. The other version, often call futures yield, involves going long futures contracts that are in backwardation and short futures contracts that are in contango. 

For example, the ReturnStacked Stocks & Futures Yield ETF (RSSY) is long UK Gilts (UK bonds) for September. That contract closed Friday at £99.85. The December contract closed at £99.37. Rolling forward could be done profitably, that is backwardation. RSSY is short DAX futures (the German stock market). On Friday, DAX futures for Sept closed at 18,694 while December closed at 18,868. It would cost money to roll forward, that is contango. 

From manager to manager I don't believe there's any differentiation in what carry is long and short but I do believe there is differentiation in how positions are weighted. If RSSY is long UK Gilts, there wouldn't be other managers who are short. Maybe other managers have larger or smaller positions but not on the other side. Typically sizing is risk weighted and I am saying the process for risk weighting might be different across different managers. 

Carry is like a cousin of managed futures. I'm trying to learn more but as best as I can tell, although carry is uncorrelated to a lot of things, it appears to be less reliable of a diversifier for equity exposure than managed futures is. Since there are no single strategy carry funds it is difficult to get a great feel how it performs in various market conditions. If you know that my comment about being less reliable than managed futures is incorrect, please leave a comment. 

Speaking of ReturnStacked, I tried to play around with a combo of the Permanent Portfolio using leverage and managed futures. This was probably inspired by yesterday's mention of the Cockroach Portfolio. What I had in mind is 60/40/40, equities/fixed income and managed futures and then a big sleeve to gold too. Using the WisdomTree Efficient Gold Plus Equity (GDE) would be a way to build this, along with the ReturnStacked Bonds & Managed Futures (RSBT). GDE offers 90% gold and 90% equities so if you put 60% into GDE you'd have 54% each into equities and gold and 40% each into bonds and managed futures by using RSBT. 

The funds are so new that it can't be backtested very far but we can back test it with the following and compare it to the Permanent Portfolio Mutual Fund (PRPFX) and the Vanguard Balanced Index Fund (VBAIX) which is proxy for a 60/40 portfolio.


Using these funds allows us to backtest the idea for ten years instead of one year due to how new RSBT is. The result is very interesting.


I just used 25% in gold, not 54%. Adding all of that leverage and the standard deviation was actually slightly lower than PRPFX and VBAIX and the return was noticeably higher. That this can be done with GDE, a S&P 500 Index fund and RSBT is positive in terms of democratizing access. 


The way these correlate, this is not assured destruction but obviously there would be pain in some sort of event where two of them went down a lot. Yes, I am skeptical about ever doing this but there is something to it and I am interested in studying it. 

Barron's had a profile on the Frost Credit Fund, the institutional symbol is FCFIX. It's a five star fund and has been around for a while. Here's the latest sector allocation compared to a year earlier.

The article makes a comparison to the Janus Henderson AAA CLO ETF (JAAA) which is a client holding. 

I think this is a good example to look forward, not to make a prediction  but understand portfolio holdings a little  better. Why did JAAA outperform in 2022 and why has it lagged FCFIX by a little bit since? CLOs are so called spread products, a spread, a higher yield, over treasuries. That helped CLOs outperform when rates were going up. The article refers to FCFIX making the decision to reduce CLO exposure because the managers believe gains can be made from regular bonds as rates go down. That's been happening and FCFIX has managed it well, outperforming JAAA. JAAA is still an excellent hold in my opinion, trouncing AGG on pace to return 7% for the year. That's the pace, there's no guarantee. 

If FCFIX is correct about gains from plainer vanilla bonds then it will continue to outperform JAAA and if they get that wrong (assuming no changes in positioning) then it makes sense to expect JAAA would outperform. 

Who knows if the managers will get that right. The FOMC pretty much said they are going to start lowering rates but that doesn't mean the middle of the curve and further out must drop in yield. If it doesn't, FCFIX wouldn't be hurt but its expected outperformance might not pan out. 

Let's play around with FCFIX in two versions of a similar portfolio with funds we don't do a lot with here.

We've mentioned BIVIX once or twice and QLEIX three or four times. We use AQMIX for blogging purposes all the time and I don't think we've looked at SPMO before.


BIVIX was the clear winner with less volatility and strong outperformance including a positive result in 2022. But there's a wrinkle with BIVIX that we've talked about before.


BIVIX outperformed by a little, earlier in the back test but 2021 and 2022 were monster years, the fund rose 61% and 49% respectively. Those two years skew the entire back test and there's no way to expect a fund to repeat such an outlier of outperformance. There's also the reasonable question of wondering whether something that could outperform by that much could also lag by that much. 

All the backtesting we do here is fun and there is utility to it but it is important to understand the why behind the results sometimes. Any backtest you might do with BIVIX fits into that category.

The information, analysis and opinions expressed herein reflect our judgment and opinions as of the date of writing and are subject to change at any time without notice. They are not intended to constitute legal, tax, securities or investment advice or a recommended course of action in any given situation.

Are You Ready If Rates Go Up?

Jonathan Hoenig Tweeted this out Yields have been trending higher of course which historically has spelled trouble for stocks. Someone else ...