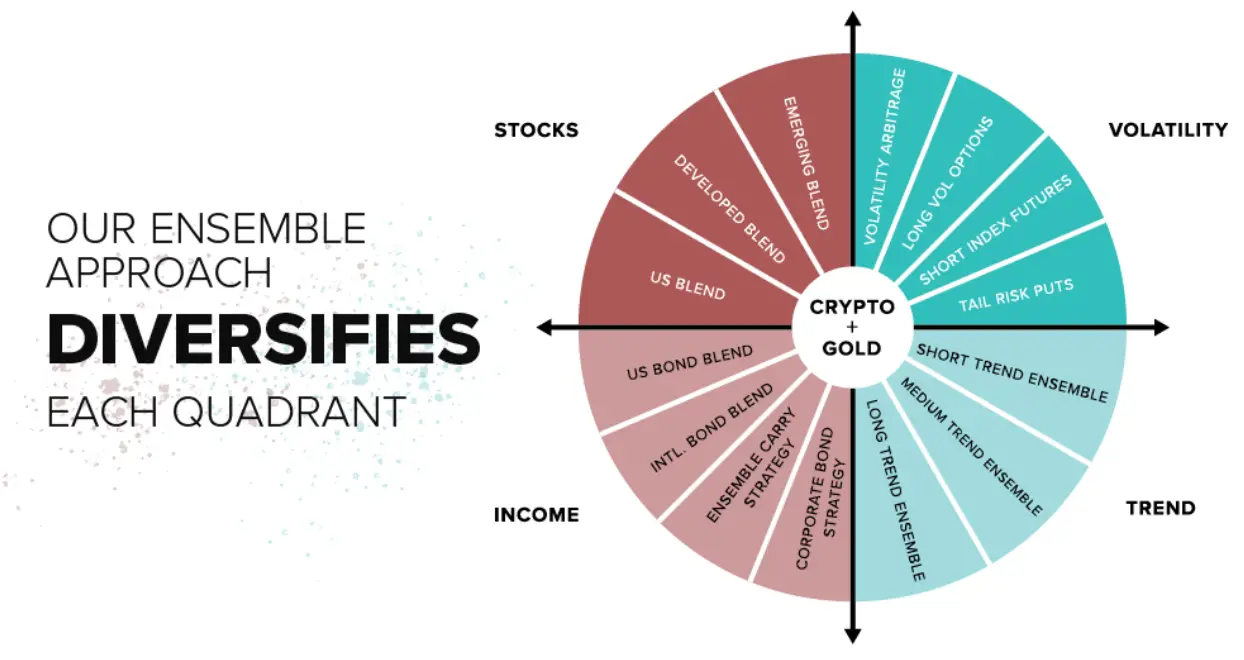
A couple of months ago we looked at The Cockroach Portfolio, a sort of all-weather portfolio that seems like it could be an attempt to update and evolve the Permanent Portfolio which allocates an equal 25% to stocks, long bonds, gold and cash. Today I wanted to try to build The Cockroach and give it a test run through portfoliovisualizer. Here's the graphic I used in the first blog post.

I will try to simplify it where I can like not having three different trend funds, I'm not even sure how to capture long versus short trend in ETPs anyway. In reading about this, what I think they do is allocate an even 20% to stocks, income (bonds), volatility, trend and gold/crypto. Here's the starting point.
This goes back to 2016 to GBTC's apparent inception. Here are the results.
The best attributes are much smaller worst year, annualized performance is good, the standard deviation is just slightly below 100% equities, the Sortino Ratio is great and despite the negative correlation, it has gone up. In 2017, as assembled, The Cockroach Portfolio went up 62% versus 21% for 100% SPY and 13% for VBAIX. That 62% gain, primarily from 4% to GBTC does a lot of heavy lifting for the entire period studied. Starting in 2018 causes the performance to change as follows.
Both the CAGR and standard deviation come way down. The drawdowns are still far superior and the market correlation, again negative, did not prevent the portfolio from going up and generally looking like VBAIX but with a much lower standard deviation. The way the portfolio is actually put together I'm sure is different but in terms of how an advisor or do-it-yourselfer might put it together using products available through the typical platform, I think this reasonably captures the effect though.
Let's compare it to the three fund portfolio I came up with the other day comprised of 65% SPY, 15% RYMFX and 20% TAIL. That will be Portfolio 2 and 100% VBAIX will still be Portfolio 3.
Both Portfolio 1 (Cockroach) and Portfolio 2 (the 3 fund mix I made up the other day) each have ways in which they are superior over the period studied from 2018 on. 2 had a slightly better CAGR but higher standard deviation and max drawdown while higher, was much better than 60/40 VBAIX. If there's one flaw about Cockroach, and you might argue it isn't a flaw, it's that a disproportionate amount of its total return came in one year, 2020. Note 2017 was even better for Cockroach so the returns are lumpy. Interesting that the standard deviation isn't higher.
It's not clear to me that the way I have it constructed, Cockroach can keep up unless Bitcoin does very well. 2019 was a pretty good year for it obviously but as has been the case with a couple of these we've looked at, 40% (RYMFX and VIXM) allocated to strategies that you'd expect to be negatively correlated to equities creates a big headwind. Equities are the thing that goes up the most, most of the time (ex-crypto).
Again, the way the portfolio is actually managed could be much different and far more effective but the take away for me is that equity volatility is a thing to be managed or if you prefer, buffered, not neutralized. Neutralizing equity volatility will deprive you of the benefit of the stock market's ergodicity.
TAIL is a client and personal holding.


No comments:
Post a Comment