Saturday, August 31, 2024

Does Your Portfolio Need To Evolve....Selectively?

One of my many quirks (we all have them) is a never ending fascination with investment portfolios that either are or are thought to be sophisticated like the Permanent Portfolio, various endowment portfolios and so on. The Trinity Portfolio by Meb Faber and Cambria Investments is another example. I've written about it a few times. The results haven't been great but the idea of trying to figure out how to allocate so much to trend is intriguing even if I'm never going to go as heavy as Meb believes in. 

In addition to the Cambria Trinity ETF (TRTY) there are six versions that as best as I can tell are separately managed accounts (SMA) offered through Betterment. The ETF allocates 25% each to equities and fixed income, 35% to trend and 15% to real assets. The six SMAs allocate as follows with Trinity 1 being the most conservative ranging to Trinity 6 as the most aggressive.

I realize that several of them don't add up to 100, you'd need to ask them about that. One mistake I think I've made with trying to replicate the concept is to assume trend just referred to managed futures. Looking through to the holdings of the ETF and the 6 portfolios, the transparency is fantastic, it looks like momentum stocks are considered part of trend. At the moment, TRTY appears to just have 7.98% in managed futures funds and it has 8.32% in one ETF with the work momentum in the name. I'm not sure what other funds would be lumped in with trend but you can look for yourself and try to figure that out. The 6 models include the Cambria Global Momentum Fund (GMOM), which is a fund of funds, but I don't see that held in TRTY currently. 

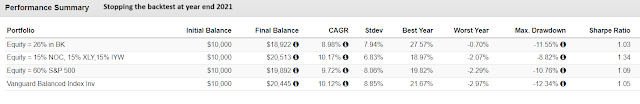
With all that in mind, I tried to backtest this a little differently to see if we can improve on past results with this which haven't been very good. Benchmarking to TRTY, we can go back almost six years.


The second portfolio is comprised of:


The result for Trinity 6 Replication might be surprising but most of the outperformance came from 2022. It was up 23% that year. The version with momentum stocks was down 2.2% that year, the 60/40 was down 16% and TRTY was down 3.3%. The second portfolio being near the top for the entire back test makes sense due to having 55% in equities.

The portfolio I labeled as Trinity w/Momentum stocks used Trinity 4 as a starting point. The Cambria website reports performance from Nov 2016-March 2024. Apples to apples, for that period Trinity 4 had a CAGR of 6.00% and standard deviation of 9.85% and a max drawdown of 19.35% while Portfolio 2 that we created had a CAGR of 8.85%, standard deviation of 8.75%, and a max drawdown of 7.21%. 

The usefulness of my quirk, aside from being fun, is to explore different sources of influence to help the portfolio evolve. The Permanent Portfolio with 25% each to stocks, gold, long bonds and cash is designed to always have at least one holding that is going up no matter what. The influence is to include something like AGFiQ US Market Neutral Anti Beta ETF (BTAL) in the portfolio. It has been very reliable for going up when the broad market goes down. Unlike the Permanent Portfolio, 25% into the thing that should go up when stocks drop would create a huge drag for the 3/4 of the time that the stock market is going up. This is why we spend a lot of time here on holdings that provide different defensive attributes than BTAL, this is where uncorrelated holdings can play a role.

The results for TRTY and what I guess are SMA versions of the Trinity Portfolio are pretty underwhelming but if you know anything about Meb, you know he's a smart dude and there is something to this approach and value in trying to learn from it. Momentum does not always outperform but there are attributes worth exploring and there are differences between the various momentum funds. For example, the iShares Momentum ETF (MTUM) lags noticeably behind some of the other more plain vanilla momentum ETFs. I would not describe GMOM as plain vanilla. 

Markets are evolving, investment products are evolving, so to me it is logical to spend time to understand whether your portfolio should evolve....selectively. 

The information, analysis and opinions expressed herein reflect our judgment and opinions as of the date of writing and are subject to change at any time without notice. They are not intended to constitute legal, tax, securities or investment advice or a recommended course of action in any given situation.

Friday, August 30, 2024

40% In Commodities? Are You Nuts?

Let's start with a quote posted by Meb Faber attributed to Cliff Asness.


No one is perfect, but I do think I've been pretty good at this for a long time. This is a skill, or maybe mindset is a better word, to cultivate and maintain.

Here's a good article on catastrophe bonds from Bloomberg. The article seemed to focus on a rough spring for the category according to Fermat Capital Management, who is a big player in the space. Let's go to the chart.


Well, um ok I guess. That's about a 1% pullback in May. Note that this is total return, Yahoo Finance is price only. They mentioned that the benchmark Swiss Re Index was only up about half as much this year so far through the same period the year before. As we mentioned though, the scare in 2022 (look at the chart for SHRIX from back then) caused a snapback that distorted prices favorably in 2023 so drawing any conclusions from 2023 might not be ideal. 

Also if you dig into that Swiss Re Index, it is heavily weighted to a couple of specific perils including wildfires I believe, it's not very well diversified when you compare it to how most of the funds are put together. I believe the Brookmont Cat Bond ETF that is in the works will be actively managed and while I am very optimistic on this space, I would avoid any indexed products if there ever are any. I am test driving EMPIX in one of my accounts for possible client use. 

The Economist took a turn crapping on Buffer ETFs. My simple answer on these is just don't with the Buffer funds. Whatever you're trying to do, there is a simpler way to do the same thing. The Economist was going after complexity a little more broadly but spent a lot of time bashing on the Buffers.

I am not against complex funds. The way I frame the portfolio is to describe it as a lot of simplicity hedged with a little bit of complexity. We all have our own definitions of what is complex or simple so it is relative. 

Bank of America, via Bloomberg, put out an interesting note that both confirmed one bias and pushed back on another bias. Believing bonds are not the place to be, confirming my bias, they argue for putting that 40% into commodities, the opposite of confirming my bias, as they apparently expect higher price inflation to persist. 


So it hasn't been crazy as far back as this backtest can go. COMT, COM and DBC are each broad based commodity funds. The various commodity blends didn't really differentiate early on, lagged a little in 2020, outperformed by a lot in 2021 and 2022, lagged again in 2023 and this year is back to not much differentiation. I've never had 40% in bonds with duration and I'm not likely to put 40% in commodities but this is interesting. 


With DBC as a proxy, going back further, there was a prolonged lag in the middle of the back test. To the Cliff Asness quote, that might have been a tough one to ride out. 

Another very new fund, a couple of weeks ago the AQR Sustainable Long/Short Carbon Aware Fund  "repurposed" into the AQR Trend Total Return Fund (QNZIX). It appears it will leverage up to have 50% in the S&P 500 and 100% in managed futures. 

I backtested the following.

And this is how I built Diversify Your Diversifiers.


BTAL and MERIX are client and personal holdings. If someone were to put it all into the strategy underlying QNZIX, the result might very well work out over the long term but there would be periods where it would struggle.


The CAGR above for AQMIX was 0.39%. QNZIX is similar to other funds. I am on board with the effect that this sort of blending can add to a portfolio but while a repeat of a 0.39% CAGR is unlikely because of interest rates' importance to managed futures, it is not impossible. Diversify your diversifiers.

The information, analysis and opinions expressed herein reflect our judgment and opinions as of the date of writing and are subject to change at any time without notice. They are not intended to constitute legal, tax, securities or investment advice or a recommended course of action in any given situation.

Wednesday, August 28, 2024

New Fund Roundup

Some new, or just new to me, funds to take quick, introductory looks at and a theory.

Earlier this month, Simplify launched the Gamma Emerging Market Bond ETF (GAEM). Despite the fund name and so many other Simplify funds using derivatives, GAEM appears to simply be a bond fund although it is quite a bit more exotic than most other emerging market bond funds, focusing on Latin America. 

The holdings include the Dominican Republic, the Bahamas, Telecom of Trinidad & Tobago bonds, even El Salvador. These types of bonds are usually dollar denominated to make them more marketable to US buyers but I haven't dug in yet to see if that is the case with GAEM. Are the El Salvadorean bonds denominated in Bitcoin? I doubt it, but hey. It's only been a couple of weeks but GAEM has been less volatile than iShares JP Morgan Emerging Market Bond Fund (EMB). That might not be real though, I don't know when it got fully invested. With almost 7% in cash now, it might not be fully invested yet. Like we mentioned the other day about cat bonds, maybe this pocket of emerging market debt has no risk or volatility until there is risk and volatility.  

The Catalyst/Aspect Enhanced Multi-Asset Fund (CASIX) just started trading at the start of the year. It seems to take a page from client/personal holding Standpoint Multi-Asset (BLNDX) by layering managed futures on top of, in this case, a passive 60/40 portfolio. We can backtest this a couple of different ways.


NTSX is leveraged up such that 67% equals 100% into a 60/40 portfolio. The first portfolio listed captures what CASIX is actually doing and the second one could be constructed very simply and should give some of the effect.

It's interesting that the version with just 33% in managed futures had a milder worst year. The CAGR of Portfolio 2 is certainly lower than Portfolio 1 but that tradeoff would be compelling if this combo could maintain that trajectory. In 2019, 2020 and 2021, all three performed very similarly. In the partial year 2018, the very leveraged version lagged by a lot in a year that was very difficult for managed futures. In 2022 both backtested versions outperformed VBAIX by a considerable margin. 

In terms of do it yourself, I think this shows that less (of the negatively correlated holding) can actually be more. I make that point all the time, there are all sorts of pundits getting on board with making huge allocations to things like managed futures. I am not in that camp and for the record, 33% is way more than I would put into managed futures. If you want that much in alts, ok but diversify your diversifiers. There's a good chance of getting essentially the same effect with much less risk of being vulnerable to something breaking or at least bending a lot like managed futures in 2018. I would also note that managed futures did worse in 2016 than 2018.

It is interesting that our attempt to backtest CASIX looked like 60/40 very frequently but deviated away considerably when investors would hope it would with 2018 being a tradeoff. 

Closing out with a theory. We've spent some time trying to figure out the carry strategy. The theory I'm putting out is that the ReturnStacked US Stocks & Futures Yield ETF (RSSY), similar to what we just talked about, will end up looking like 60/40 much of the time and hopefully for holders, it will diverge when holders would hope that it would. Where RSSY is levered up 100/100, I don't think the correct comparison is putting everything into RSSY versus 100% into VBAIX. There's probably a number in the 40-60% range in RSSY, the rest in cash, to see whether my theory will turn out to be right or wrong.

RSSY has only been trading since late May and so far my theory is not obviously wrong but it is way too soon to draw a conclusion. I'm quite certain at this point, I'm never going to use the fund but it's done a great job bring in assets so far and while I am curious, I imagine there's about $150 million that cares. 

The information, analysis and opinions expressed herein reflect our judgment and opinions as of the date of writing and are subject to change at any time without notice. They are not intended to constitute legal, tax, securities or investment advice or a recommended course of action in any given situation.

Monday, August 26, 2024

Poking and Picking At Complexity

Seven months ago I wrote about the then brand new Defiance Treasury Alternative Yield Fund (TRES). It was a derivative income fund that bought short term treasuries and sold option combos on ETFs like iShares 20+ Year Treasury ETF (TLT). The fund closed in late July.

TLTW owns TLT and sells covered calls against that ETF. In March, I guess treasuries got hit a little bit in March, TRES got destroyed and then continued to deteriorate from there. This seems to be a particularly poor result and maybe even an outlier result but it is a perfect example of why it's a good a idea to let a complex fund have some time to set expectations for how it might do. Sometimes you might just know and fund will work but for the times you don't know, it's ok to wait. 

Also from the wayback machine, six months ago I wrote about the Calamos Alternative NASDAQ and Bond ETF (CANQ). It's a leveraged fund with 90% in bonds and then either 90% or 100% in call options on certain stocks in NASDAQ 100 Index. The either 90 or 100 comment relates to whether they mark the stock at the out of the money strike price or at the market price. The idea is to create a proxy for convertible bonds. Are they doing that?


Yeah, probably so. It's close enough but outperforms the one actively managed mutual fund ANNPX I chose and the indexed CWB. I threw in RSSB because it owns stocks and bonds with leverage similar to CANQ I'd say. The correlation is close but RSSB has outperformed by a decent bit.

So, ok, six months in and it is probably doing what they had in mind. Here's the thing though, I'm not sure what problem this solves. Just because it mostly does what they say it should do, doesn't mean there's a reason to own it. For now, it only has $1.3 million in it so maybe no one else can figure out what problem it's solving either. 

One of my favorite hobbies is writing about how risk parity funds usually don't work. I've picked on the Risk Parity ETF (RPAR), an indexed product, more than a few times but this should be a little different. I think the fund might be broken. Here's the target asset allocation. Keep in mind that it is risk parity so there is leverage involved.

To replicate it, I built it out as follows.


RPAR owns VTI, VWO and VEA. I worked in SSO and UBT to be able to leverage up to the right asset allocation. Then I tweaked it to shorten up the duration a little bit to the middle of curve as follows.


XME is a client holding.


RPAR tracks very close to the replication for the first two years and then it separates from it in early 2022. RPAR lagged the replication by 614 basis points in 2022. Interestingly, the replication was down 16.66, almost identical to Vanguard Balanced Index (VBAIX) which is a proxy for a 60/40 portfolio despite looking very different from 60/40. The one divergence in early 2022 doesn't explain the entire lag though. In 2023 RPAR lagged behind the replication by 385 basis points. There can be hiccups when using futures but it is trailing so far this year too.

I think the way I built the replication is pretty true but please leave a comment if I have a mistake in there. It makes sense that the shorter duration version trades differently than the other two. From here, if yields go down quickly, then the shorter duration version will lag instead of outperform.

This is an argument for avoiding complexity. When RAPR first came out I was intrigued but cautious. Multi asset or multi strategy absolutely works in some instances but clearly doesn't in other instances. When you're interested in one of these, take the time to pick it apart and really poke at it. 

The information, analysis and opinions expressed herein reflect our judgment and opinions as of the date of writing and are subject to change at any time without notice. They are not intended to constitute legal, tax, securities or investment advice or a recommended course of action in any given situation.

Sunday, August 25, 2024

Don't Rely Solely On Backtesting

The only place talking about the strategy known as carry has been the ReturnStacked guys. That might be a slight exaggeration and I did find someone else talking about it, a short paper by Campbell & Company. The explanations of what carry tend to be complicated but I think I can distill it to be simpler even if it is too simplistic. 

There is the version where carry is the return just by holding an asset like the dividend from stock or the interest from the bond. There is the carry trade where you borrow or sell short a low yielding currency and buy a high yielding currency and make the difference between the interest paid on the borrowed currency and the interest earned on the currency that was bought. The other version, often call futures yield, involves going long futures contracts that are in backwardation and short futures contracts that are in contango. 

For example, the ReturnStacked Stocks & Futures Yield ETF (RSSY) is long UK Gilts (UK bonds) for September. That contract closed Friday at £99.85. The December contract closed at £99.37. Rolling forward could be done profitably, that is backwardation. RSSY is short DAX futures (the German stock market). On Friday, DAX futures for Sept closed at 18,694 while December closed at 18,868. It would cost money to roll forward, that is contango. 

From manager to manager I don't believe there's any differentiation in what carry is long and short but I do believe there is differentiation in how positions are weighted. If RSSY is long UK Gilts, there wouldn't be other managers who are short. Maybe other managers have larger or smaller positions but not on the other side. Typically sizing is risk weighted and I am saying the process for risk weighting might be different across different managers. 

Carry is like a cousin of managed futures. I'm trying to learn more but as best as I can tell, although carry is uncorrelated to a lot of things, it appears to be less reliable of a diversifier for equity exposure than managed futures is. Since there are no single strategy carry funds it is difficult to get a great feel how it performs in various market conditions. If you know that my comment about being less reliable than managed futures is incorrect, please leave a comment. 

Speaking of ReturnStacked, I tried to play around with a combo of the Permanent Portfolio using leverage and managed futures. This was probably inspired by yesterday's mention of the Cockroach Portfolio. What I had in mind is 60/40/40, equities/fixed income and managed futures and then a big sleeve to gold too. Using the WisdomTree Efficient Gold Plus Equity (GDE) would be a way to build this, along with the ReturnStacked Bonds & Managed Futures (RSBT). GDE offers 90% gold and 90% equities so if you put 60% into GDE you'd have 54% each into equities and gold and 40% each into bonds and managed futures by using RSBT. 

The funds are so new that it can't be backtested very far but we can back test it with the following and compare it to the Permanent Portfolio Mutual Fund (PRPFX) and the Vanguard Balanced Index Fund (VBAIX) which is proxy for a 60/40 portfolio.


Using these funds allows us to backtest the idea for ten years instead of one year due to how new RSBT is. The result is very interesting.


I just used 25% in gold, not 54%. Adding all of that leverage and the standard deviation was actually slightly lower than PRPFX and VBAIX and the return was noticeably higher. That this can be done with GDE, a S&P 500 Index fund and RSBT is positive in terms of democratizing access. 


The way these correlate, this is not assured destruction but obviously there would be pain in some sort of event where two of them went down a lot. Yes, I am skeptical about ever doing this but there is something to it and I am interested in studying it. 

Barron's had a profile on the Frost Credit Fund, the institutional symbol is FCFIX. It's a five star fund and has been around for a while. Here's the latest sector allocation compared to a year earlier.

The article makes a comparison to the Janus Henderson AAA CLO ETF (JAAA) which is a client holding. 

I think this is a good example to look forward, not to make a prediction  but understand portfolio holdings a little  better. Why did JAAA outperform in 2022 and why has it lagged FCFIX by a little bit since? CLOs are so called spread products, a spread, a higher yield, over treasuries. That helped CLOs outperform when rates were going up. The article refers to FCFIX making the decision to reduce CLO exposure because the managers believe gains can be made from regular bonds as rates go down. That's been happening and FCFIX has managed it well, outperforming JAAA. JAAA is still an excellent hold in my opinion, trouncing AGG on pace to return 7% for the year. That's the pace, there's no guarantee. 

If FCFIX is correct about gains from plainer vanilla bonds then it will continue to outperform JAAA and if they get that wrong (assuming no changes in positioning) then it makes sense to expect JAAA would outperform. 

Who knows if the managers will get that right. The FOMC pretty much said they are going to start lowering rates but that doesn't mean the middle of the curve and further out must drop in yield. If it doesn't, FCFIX wouldn't be hurt but its expected outperformance might not pan out. 

Let's play around with FCFIX in two versions of a similar portfolio with funds we don't do a lot with here.

We've mentioned BIVIX once or twice and QLEIX three or four times. We use AQMIX for blogging purposes all the time and I don't think we've looked at SPMO before.


BIVIX was the clear winner with less volatility and strong outperformance including a positive result in 2022. But there's a wrinkle with BIVIX that we've talked about before.


BIVIX outperformed by a little, earlier in the back test but 2021 and 2022 were monster years, the fund rose 61% and 49% respectively. Those two years skew the entire back test and there's no way to expect a fund to repeat such an outlier of outperformance. There's also the reasonable question of wondering whether something that could outperform by that much could also lag by that much. 

All the backtesting we do here is fun and there is utility to it but it is important to understand the why behind the results sometimes. Any backtest you might do with BIVIX fits into that category.

The information, analysis and opinions expressed herein reflect our judgment and opinions as of the date of writing and are subject to change at any time without notice. They are not intended to constitute legal, tax, securities or investment advice or a recommended course of action in any given situation.

Saturday, August 24, 2024

Replicating The New Zealand Sovereign Wealth Fund?

New Zealand has a sovereign wealth fund with the equivalent of $46 billion in it and the FT says it is doing pretty well. The article doesn't seem to know exactly how it is managed but has a good idea I guess. Basically, the majority is actively managed and the rest is passively managed. The following is the active part.

And then from there, the rest is apparently passive. It can be replicated which I built as follows.

And this is how I tested it

Both Portfolio 1 which I'd say is the truer version and version 2 increased proportionally do a little better than VBAIX but with slightly higher volatility. The both did slightly better than VBAIX in 2022. We regularly use Blackstone (BX) for blogging purposes but if we'd used one of the private equity ETFs, the results of Portfolios 1 and 2 would have been far inferior. 

Meb Faber hosted Andre Rzym and Tarek Abou Zeid from Man HL for a podcast all about catastrophe bonds. I've been saying for a while that this is a space to learn about and the podcast makes some great points. Zeid made a sort of joke that I have made before. I've said you don't need diversification until you need diversification. Zeid said there is no risk in cat bonds until there is risk and there is no volatility in cat bonds until there is volatility. In a recent post I noted one of the mutual funds in the space got hit in late 2022 because of Hurricane Ian. A little more precisely, that fund got hit because of worries that it would get hit. The bonds went down some in price but there weren't any, or very few, triggering events causing the bonds to snap back leading to disproportionately large returns in 2023.

At the end, Ryzm made an off the cuff comment about airplane leasing stocks being interesting on some level. There are several plane leasing companies. I wrote about them a couple of times, ages ago including here at TheStreet.com in 2007. I would describe my take on them back then as mildly interested in learning more but unlikely to pull the trigger because of how capital intensive the businesses are. Back then, these were yield plays but that doesn't seem to be the case anymore. Rzym's context was overlaying a systematic strategy onto these companies but I'm not sure what he meant. Here's the correlation of the stocks I could find in this space.


In terms of being diversifiers, those correlations all seem high to me except for ATSG. 


Owning one doesn't appear to have made things worse in a meaningful way, hard to say any of them were great additions but all three 80/20 portfolios went down a little less than 100% S&P 500 in 2022. 

Rob Isbitts wrote a short article for ETF.com that perplexed me a little bit. The article was generally about investor impatience which makes sense with five or six stocks accounting for almost 2/3 of the S&P 500's gains this year but appears to compare the iShares Core Growth Allocation ETF (AOR) to the S&P 500. AOR is a proxy for a 60/40 portfolio. It has lagged behind VBAIX more often than not lately due to AOR including foreign stocks and foreign bonds in its mix. I can't tell if he is lamenting that AOR has lagged behind the S&P 500 or trying to caution advisors that clients might be sweating it. He does think that 60/40 where the 40 is allocated to the Aggregate Bond Index or long treasuries is over-rated and I am definitely on board with that idea. 

Jason Buck from Mutiny Funds sat for the Excess Returns podcast. He was on to take the other side of stocks for long run noting various pockets of time where certain equity markets have done extremely poorly. Japan for 30 whatever years recently, US markets a several times in the last 100 years, he also cited a period where the Italian equity market was down 74% in the 60's or 70's (I believe he said). Where no one can reliably predict when these sorts of events will happen it makes sense to Buck to always have a lot of defense in place. His Cockroach Fund targets 50% in defense. 

Inspired by the Harry Browne Permanent Portfolio, Cockroach allocates 25% each to stocks and income which are offense as well as 25% each to (mostly) long volatility and trend which are defense. There is also a 20% sleeve to fiat hedging which is a mix of gold and Bitcoin so there is leverage in there somewhere and while fiat hedging sounds defensive to me but I don't know if they think of it that way.

Cockroach has 25% in equities but Jason made a comment toward the end that based on risk weighting, instead of having a 60/40 portfolio, it should be more like 40% in equities. I chuckled because back in June we tried to replicate it and used a 40% weight to equities as follows.

Truly replicating the Cockroach Portfolio is difficult due to lack of access to volatility strategies. Most long volatility funds bleed something awful. We talk about the Alpha Architect Tail Risk ETF as possibly having less bleed but the track record on that one is very short and I am pretty skeptical of that fund for now. 

The information, analysis and opinions expressed herein reflect our judgment and opinions as of the date of writing and are subject to change at any time without notice. They are not intended to constitute legal, tax, securities or investment advice or a recommended course of action in any given situation.

Friday, August 23, 2024

Derivative Income Funds Level Up

We spend a lot of time bagging on the Global X Covered Call ETF (XYLD) for how little upcapture it has.


The above chart excludes dividends. Without the yield, the compounding is negative. Today I learned there is another variation from Global X, the Global X Covered Call & Growth ETF (XYLG). It is similar to XYLD in that it sells a very near the money, monthly call option. It differs from XYLD is that call are only sold against half the equity portfolio. Where the entire XYLD basket of stocks is pegged at the option's strike price, only half the portfolio of XYLG is pegged so half of the fund can track the index higher which of course it does most of the time. 


XYLG has only been around since late 2020 but it has generally done what you'd expect with returns in between the regular S&P 500 and XYLD. It's not perfectly in the middle but it's close, same with the standard deviation. XYLG's yield was in the 7% range in 2022 and 2023 and seems to be headed there again this year. In 2022, when the S&P 500 was down 18%, XYLG was down 15.5% on a total return basis and down 20% on a price basis. An investor who reinvested the dividends would focus on the 15.5% number and someone who spent the dividend would focus on the 20%. The upcapture on a total return basis was 75% of the S&P 500 with about 85% of the worst downside. 

Yesterday I mentioned that ProShares S&P 500 High Income ETF (ISPY) might have the best combination of upcapture and yield in the derivative income fund space but it occurred to me that XYLG could be in the same ballpark, and it turns out that it is so far but it is still a very short sample period. 

I would not assume that ISPY will always be out in front of XYLG but I do think they will be close to each other most of the time. XYLD and some of the others are going to have higher yields but if ISPY and XYLG can stay close to 7%, that is a shade better than quadruple the market cap weighted index' yield and you can get some upcapture. Oddly, four year old XYLG only has $62 million while eight month old ISPY has $230 million. ISPY is in my ownership universe.

Trying to use XYLG in a portfolio, I built the following to compare.


The thought process is using XYLG as a proxy for backtesting ISPY. Everything is labeled. And here's the portfolio income. Putting 20% into XYLG in Portfolio 1 got the overall yield up to 5% a couple of years but is on pace to come up short of 5% this year.


The rest of Portfolio 1's numbers are pretty good. 

I don't know if this is going anywhere but I believe it supports the ongoing idea that all of these exposures continue to evolve/improve and that it is worthwhile to invest time into staying current as these various strategies evolve. 

The information, analysis and opinions expressed herein reflect our judgment and opinions as of the date of writing and are subject to change at any time without notice. They are not intended to constitute legal, tax, securities or investment advice or a recommended course of action in any given situation.

Thursday, August 22, 2024

The Tradeoffs Of Low Volatility

Bob Elliott who manages the Unlimited Hedge Fund ETF (HFND) had a blog post that took a dim view of the defined outcome funds, also known as buffer funds. Read the post but the following graphic stood out to me.


WRT to buffer funds, Bob did the work to show whatever you're trying to achieve with a buffer fund can be done in a better way. We've made that point here quite a few times. The graphic also starts to go down a road we've gone many times which is how to think about diversification differently, how to reduce the volatility of the overall portfolio, irrespective of what individual components are doing. Focusing on the trees (individual holdings) instead of the forest (the portfolio) is referred to as line item risk. Invoking Jason Buck, if you're diversified, you will always have a couple of holdings that make you want to puke. 

A few days ago, we took as quick look at how some diversifiers did during The Great Hiccup of August, 2024. Reading the post from HFND made me curious about how that fund did and maybe a couple of others. I mentioned this in some post that while it seemed like The Great Hiccup is destined to be forgotten, it is a good event to learn from.


HFND and HEQT should have smaller swings in both directions. They generally meet that expectation but of course that means over longer term trends where stocks go higher, they are unlikely to keep up. For the month they look good of course. They could be the anchor for a portfolio that doesn't need to keep up with the broad market longer term or as a tool around an anchor to help manage volatility. 

ISPY is a covered call fund that I've mentioned a couple of times. It is in my ownership universe for just a couple of clients but I think it is the best choice for combining decent yield with decent upcapture when looked at versus the other derivative income funds. Covered call funds should not be thought of as a place to hide or crisis alpha. It went down inline with the S&P 500 which is what I'd expect. 

I don't know what RSSY should look like during a fast decline but we talk about it enough that I just threw it in. While we're talking about ReturnStacked ETFs, they launched the Return Stacked Bonds & Futures Yield ETF (RSBY) today. Like it's other funds, it is a 100/100 fund, bonds and carry. I don't know what to expect from RSSY like I just said and I don't know what to expect from RSBY either. RSSY has $148 million in AUM per Yahoo Finance. I've seen other people talk about carry in a favorable light but I would suggest treading lightly for now. 

Moving on to repeat a point we've made before but is worth revisiting. Portfolio 1 is a blend of simple equity beta and alts that we talk about regularly here. For now, the details don't matter.


The volatility is about half of Vanguard Balanced Index Fund (VBAIX) which is a proxy for a 60/40 portfolio. The tradeoff for such a low standard deviation is a slightly lower CAGR. I highlighted various declines in the ten year period we're studying and you can see the ride is much smoother. 

That sort of long term result is probably appealing to plenty of people but look at the year by year.

There are several years in there where Portfolio 1 was up less than half of what VBAIX did. Those years are difficult to ride out. If we project out forward another ten years, I think it is reasonable to believe that Portfolio 1 would be kind of close to VBAIX with a smoother ride but with more years where it is only up half of what VBAIX does. There are countless valid ways to construct a portfolio. Maybe Portfolio 1 is valid, maybe it isn't but any portfolio that is valid will have periods where it lags. Knowing and accepting that ahead of time hopefully makes it easier to remain patient over the course of a cycle. A portfolio strategy is chosen for a reason(s), let it work for you over the course of the cycle. 

The information, analysis and opinions expressed herein reflect our judgment and opinions as of the date of writing and are subject to change at any time without notice. They are not intended to constitute legal, tax, securities or investment advice or a recommended course of action in any given situation.

Tuesday, August 20, 2024

Closed End Fund Palooza & A Follow Up

 A reader asked about the 15/15/15 portfolio we studied on Monday. He wanted to know how it did in The Great Hiccup of August, 2024. It was too soon to know from Portfoliovisualizer I said but remembered that the backtesting tool at Arch Indexes can do this.

As a reminder, this is the portfolio;

  • 15% Northrup Grumman client holding
  • 15% iShares US Technology ETF client holding
  • 15% SPDR Consumer Discretionary ETF client holding
  • 10% Stone Ridge Hi Yield Reinsurance this is a cat bond fund
  • 10% AQR Managed Futures
  • 5% BTAL client/personal holding
  • 30% iShares US Treasury Floating Rate

Running it through Arch Indexes for one month;


And the chart


The 15/15/15 is the purple line. BTAL and NOC went up a lot, the two sector ETFs did worse than the S&P 500 as should be expected, we noted this yesterday, and AQMIX did about the same as the SPX. I don't put much stock into what amounts to a bad week but it's still an interesting result and better than completely blowing up. It is worth repeating that I chose two sectors that are usually more volatile than the broad market which of course cuts both ways. And I think defense companies might be the most important theme so I went with the name I've owned for 20 years for clients. The rest are all names we talk on the blog about all the time.

Bloomberg wrote up a warning about the ReturnStacked ETFs. There's a free version at Yahoo Finance to read. Yes there should be less risk with leverage that blends assets or strategies with a negative correlation but as popular as these funds are out of the blocks, I feel confident that people are using leverage incorrectly and just because the blend of negatively correlated assets should not blow up doesn't mean they can't blow up. The realistic consequence of layering 10% of managed futures on top of a portfolio is probably some sort of noticeable underperformance. But as is the case with just about every market calamity where leverage is part of the story, the people most hurt are the people who misuse the leverage. 

We don't spend much time on closed end funds (CEF). Here's a thread from Twitter from a CEF-centric account that lists a bunch of 13f disclosures of CEF portfolios. I'm not a big fan of CEFs but there could be some utility. I hope to find time to dig into some of these and refamiliarize myself with this niche. 

The information, analysis and opinions expressed herein reflect our judgment and opinions as of the date of writing and are subject to change at any time without notice. They are not intended to constitute legal, tax, securities or investment advice or a recommended course of action in any given situation.

Monday, August 19, 2024

Using Leverage Without Using Leverage Part 2

Let's follow up on Part 1. In that post we looked at a form of barbelling equity exposure to get full equity like returns from a smaller, more volatile holding. In the blog post we considered roughly a 30% weighting to a private equity manager stock. We tried three different stocks in this manner and the results across all three were very similar. 

I tried to recreate the effect with a couple of broad based funds that often have higher volatility but didn't have luck making it work. It occurred to me that we could get closer to the result yesterday that the private equity stocks generated with a couple of sector funds. Technology and consumer discretionary tend to have bigger moves than the S&P 500 in both directions. Here's what that looks like for the last 15 years.


Both iShares US Technology (IYW) and SPDR Consumer Discretionary (XLY) have been client holdings for more than 15 years. To further avoid the insanity of 30% into one private equity manager stock, I also will add client holding Northrup Grumman (NOC). I've held that name for 20 years for clients as well. It's not the best performer but sadly defense industry stocks might be the most important investment theme. I don't feel like this is cherry picking because I've owned NOC for so long and what person who has been in the investment industry for any length of time doesn't know tech and discretionary usually, not always but usually, go up more than the broad market and down more than the broad market?


Beyond the equity exposure of each portfolio we backtested below, I used the above alts consistent with how we often blog about all this. Beyond the equities as labeled and the alts above, the rest all went into iShares Treasury Floating Rate (TFLO) as the fixed income allocation.


Portfolio 2, the one where 45% split between NOC, XLY and IYW is competitive with all the rest and the Sharpe Ratio is quite a bit higher but the standard deviation really sticks out for how low it is. Year to year, Portfolio 2 never got left too far behind.


There is a skew though. In 2022, NOC was up 42% which tilted the entire portfolio in a way that might not be repeatable.


NOC was not crisis alpha in The Financial Crisis, not even a little bit. The next time the stock market has a serious decline, I wouldn't expect NOC to put in a repeat of 2022. It might of course but there should be no expectation. 

After I typed that paragraph, it occurred to me to stop the back test at year end 2021.


Ok, so there is something to this after all despite the 2022 skew. 

Parts 1 and 2 in this series are really just trying to think through an idea. Barbelling has a little influence in how I build the portfolio. The three equity position version we worked on today is less crazy than yesterday's 30% to one private equity stock to make up the entire equity allocation. I am intrigued but don't know if this can go any further, we'll see. If you have ideas on how to teak this to be more realistic, please leave a comment. 

The information, analysis and opinions expressed herein reflect our judgment and opinions as of the date of writing and are subject to change at any time without notice. They are not intended to constitute legal, tax, securities or investment advice or a recommended course of action in any given situation.

Using Leverage Without Using Leverage Part 1

We've talked about private equity companies being sources of alpha quite a few times. I'm not saying they are proxies for private equity investing, they are companies that operate private equity funds and they clearly benefit from the space without being proxies. Some of them anyway.

There are a couple of ETFs that track the space. One of the oldest ones is the Invesco Listed Private Equity Fund (PSP). Here's an article I wrote about it at theStreet.com when it first listed in late 2006. I was not a fan out of the gate on this one. I questioned whether blending the various companies together would wash out the effect of owning just one or two individual names. I thought it would be a source of volatility but maybe add some yield. 


Most of that was correct but I'm shocked at how poorly it's done. ETFs are not the answer for every exposure as is the case here. That's not really the point of this post though, I just stumbled into the poor performance of PSP as I started to prepare to write this post. 

We've talked around this point at the margin but some of the public equity stocks look like high octane proxies for the broad stock market. Taking a page from Taleb's idea of barbelling the portfolio to get most of the return out of a smaller slice of the assets and how that corresponds to capital efficiency and return stacking, I wanted to build out theoretical portfolios that use smaller allocations to private equity manager stocks to provide the same return contribution from a normal allocation to the S&P 500.


There's some statistical context. The returns from year to year are very lumpy but the long term results across all three stocks in terms of growth and volatility has been pretty uniform. The correlation of all three to the S&P 500 is in the range of 0.70. Equaling the S&P 500 looks like this.


So return weighted, not volatility weighted but it's close on the volatility. Below, modeling out a 60/40 comparison, 28.2% into BX would equal 60% into the S&P 500 and 29.4% and 27% into KKR and APO respectively equal 60% into the S&P 500. Using ReturnStacked ETFs' investment process that leaves roughly 30% of the portfolio to stack alternatives on top.

We'll use 40% the iShares Aggregate Bond ETF (AGG) to hopefully better assess the benefit or lack thereof for using the private equity stocks this way and the alternative stacking. First though is the private equity stocks, AGG and the rest in T-bills (no alts).


The return weighted private equity versions are all in the ballpark versus plain vanilla 60/40. Next, we'll build in some alt exposure to see if any aspect the results improve. We'll put 10% each into managed futures, merger arbitrage and global macro-ish.


The other two have the amounts of BX and KKR I mentioned above. MERIX is a client and personal holding. 


All three benefitted from this with their respective CAGRs. There was not much help with standard deviation but the Sharpe Ratios are lower and the correlation of all three is close to 0.70. They all did better in 2022.


There are plenty of flaws to this including the weighting to just one stock and how lumpy the returns have been. There is a prompt to wondering whether the effect could be recreated with any sort of broad based ETF. Based on the following sample, I don't think so but if you play around with this and come up with any, please comment on this post.


There's something to all of this, it supports the idea of barbelling even if we haven't found a practical way to implement yet. In the real world, 30% into one stock seems insane to me. But someone could build a basket of names with similar volatility profiles as the private equity stocks to get a similar effect. 

The information, analysis and opinions expressed herein reflect our judgment and opinions as of the date of writing and are subject to change at any time without notice. They are not intended to constitute legal, tax, securities or investment advice or a recommended course of action in any given situation.

Insane Portfolio Construction

Jason Zweig did a quick and entertaining hit titled What's Left to be ETF'd meaning what can be made into an ETF that hasn't al...