Thursday, November 28, 2024

Can Low Volatility Replace 60/40?

This will be fun. We spend some time here trying to crack the factor code in pursuit of better risk adjusted returns. It's difficult to draw any firm conclusions, more like making some observations that appear to repeat....sometimes. 

That brings to this research paper by Robeco Quantitative Research and Erasmus University. I would describe the paper as seeking how to use low volatility equities in various ways to replace some or all of a traditional 60% equities/40% bonds portfolio. The paper introduces the idea of mixing momentum and value in some combo that they never quantified as a possible substitute for low volatility before digging in more deeply into different examples or cases. 

The first example to look at they call Leverage In The Strategic Asset Allocation via this table in the paper.


These are easy to model. We'll use Fidelity Low Volatility Factor ETF (FDLO) as a proxy for low volatility for this post. 


The results here are consistent with the paper. All three portfolios outperform VBAIX which is a proxy for a 60/40 portfolio and they do so with lower volatility and better Sharpe Ratios. The results are not skewed by one year. The distribution of results are pretty even. All three were better than VBAIX in 2022 by 150-550 basis points. 

The second one I'll mention is called "Absolute Returns."

I put absolute return in quotes because the returns on the middle column aren't what I would associate with absolute return. The middle column can be modeled easily and if you click through and read that section, I think they are clearly pointing to client and personal holding BTAL which goes long low volatility names and short high volatility names. 


Remember, the idea is to see if a better risk adjusted result versus 60/40 can be found not better versus 100% equities. With the "Absolute Return" study, 70/30 and 60/40 both have interesting results. If you care about Sharpe Ratios you might be drawn to the 70/30 combo. Of the individual years available to study, the distribution of returns was even about half the time with two instances where VBAIX was way ahead of the FDLO/BTAL combos and two years where VBAIX was way behind. 

The last one I'll look at is including a put option overlay. Our study will be simpler than the paper, we'll just use the Simplify PLUS Downside Convexity (SPD). I've bagged on SPD quite a few times. Somehow, it did worse than the S&P 500 by several hundred basis points in 2022. The result then is interesting in the context of trying to replace 60/40.


While I don't believe SPD is a replacement for VBAIX, the concept of what they are trying to do turned out to be pretty close to VBAIX going back to SPD's inception. Based on the chart, I'm guessing that SPD was positioned in such a way as to miss the bounce that started in late 2022. If you want to give them the benefit of the doubt that whatever happened in late 2022 won't happen again, the idea doesn't seem farfetched. That would really be a big bet though on a fund that failed its first test. 

There are a couple of other examples they looked at if you want to click through. Of the three we looked at, the FDLO and BTAL combo is the most interesting. It has better stats than VBAIX and removes bond duration which, banging the same drum again, I want no part of. 

Closing out, we'll take the 70/30 of FDLO/BTAL and tweak it a little closer to our typical conversation to add in managed futures and floating rate.


The CAGR of the 60/20/10/10 is a little lower than 70/30 but it does better in terms of volatility and risk adjusted return. Putting 30% or 20% into BTAL is really a big bet. While it hasn't had a problematic period of not working out in the past, if that did happen the next time there's a huge equity market decline, a portfolio that heavy in the fund would get pasted. 

The information, analysis and opinions expressed herein reflect our judgment and opinions as of the date of writing and are subject to change at any time without notice. They are not intended to constitute legal, tax, securities or investment advice or a recommended course of action in any given situation.

Wednesday, November 27, 2024

I Cracked The Cockroach! Maybe!

We've had a lot of fun over the last year or two looking at the Cockroach Portfolio run by Jason Buck and Mutiny Funds. It is Permanent Portfolio inspired. Where the Permanent Portfolio allocates 25% equal portions to stocks, long bonds, cash and gold with the goal of having at least one of the four going up at all times, the Cockroach Portfolio allocates as follows.

We haven't had much luck trying to replicate it thus far but as I was listening to Jason on some podcast recently I had some further thoughts on how to get to something useful for investors. Part of the reason it has been difficult to replicate is that ETFs and mutual funds we'd have access to are probably not as good as the myriad of managers that Mutiny can access to add into the Cockroach. And there are a couple of sleeves that probably can't be accessed at all.

Using the word replication may not be precisely correct, the objective with these sorts of posts is to take what by all accounts is a successful asset allocation strategy and see if there is a way to apply some of the principles even if we can't nail down short versus medium versus long trend. 

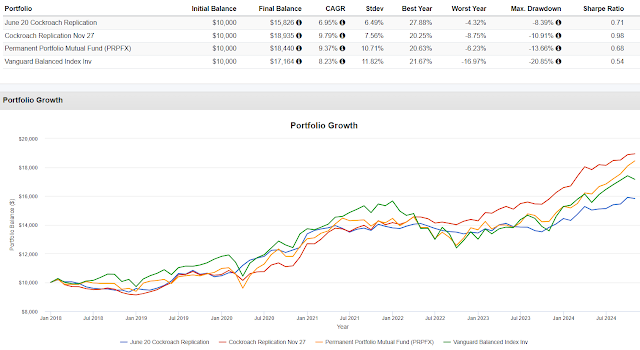
Back in June we built out the following in an attempt to replicate it as closely as possible. 


The actual Cockroach Portfolio is leveraged but I reduced the weightings down proportionately to take the leverage out as follows. Below is the updated attempt at replicating the strategy.


There are some changes compared to what we did in June. The equity exposure shifted to momentum from market cap weighted. Relative value can be expressed as a form of long/short that seeks outperformance as opposed to arbitrage or market neutral so I added QLEIX. I used client holding CBOE as a proxy for long volatility. It takes on some attributes of VIX when the market goes down along the lines of if VIX goes up 5% in reaction to something, CBOE might go up some fraction of 5% (casual observation).

Client and personal holding ASFYX has a shorter trend overlay on top of the more normal 200 day/10 month trend and I added EBSIX for a little diversification and that is a name we use regularly for blogging purposes. With TFLO and client holding BKLN, we are taking duration out of the fixed income sleeve more in line with my thoughts. 


The June version doesn't keep up with the November version, PRPFX or VBAIX but it was down the least in 2022 and has the lowest standard deviation. The November version was the best performer and the standard deviation looks good too, probably thanks to removing the terrible run that bonds with duration had along with the volatility that space has taken on. Both the June and November versions handled the 2020 Pandemic Crash much better than PRPFX and VBAIX and as I mentioned, they did better in 2022. The Calmar numbers are surprising at 0.80 for the June version, 2.60 for the November version, 0.66 for PRPFX and 0.17 for VBAIX. Higher is better for Calmar.


The portfolio names here self explanatory. Where Cockroach views Bitcoin as a hedge against some sort of bad outcome with fiat currencies, I'm changing the idea to be about asymmetry. Bitcoin has an obvious asymmetric outcome, it could go up a ton or crap out entirely. Portfolio 1 then has no asymmetry, the gold plus Bitcoin sleeve in the actual Cockroach is entirely allocated to gold. Portfolio 2 is what we looked at above (I don't know why the CAGR and the other data points are different) and Portfolio 3 uses client holding Novo Nordisk (NVO) which has turned out to deliver a different type of asymmetric return.

I did it this way so that you can decide whether you think asymmetric exposure is worth adding or not. Yes, NVO is cherry picked but that is not about looking forward but a different look at what getting asymmetry right can add to a portfolio. Of course, something with asymmetric potential could fail miserably. Maybe along the lines of Taleb, someone believing in adding asymmetric opportunities would split up the 4.15% we're assuming for this blog post. 

The November version has some compelling attributes and is far more realistic than any other versions we've played around with. One thing that could hold it back is it really only has 33%+/- in equities, the two momentum ETFs, CBOE and QLEIX sort of. In the last ten years, QLEIX has looked somewhat similar to equities five times and looked very different the other five. It is also worth mentioning that of the years available to backtest, the November version only was the best performer of the four, one time. The long term result has been valid but year to year it might have been difficult to sit with. 

Please leave a comment if you have a different angle to construct this idea.

The information, analysis and opinions expressed herein reflect our judgment and opinions as of the date of writing and are subject to change at any time without notice. They are not intended to constitute legal, tax, securities or investment advice or a recommended course of action in any given situation.

Tuesday, November 26, 2024

Hedged Equity ETFs? We're Just Getting Started

Quick hits galore today.

Tema ETFs is throwing in on ETFs that try to find a middle ground between exchange traded products (ETP) and annuities similar to LifeX from Stone Ridge. For anyone new, I am not a fan of annuities as we know them now, not even a little bit, but the idea of annuitizing an income stream from an ETP based on a longevity pool is worth exploring and a space that will evolve. Maybe what Tema has filed for will be the solution or maybe just a step closer to the solution. 

Per the prospectus, they will be more multi-asset in nature than the LifeX suite. The prospectus also uses the term glide path which is more commonly associated with target date funds. I've never been a fan of target date funds either but would want to learn more about annuitizing the income from the Tema suite if that's what's going on. Doing a control f search of the prospectus, I didn't find the term longevity pool so maybe they're just half annuitized. This remains a space worth keeping tabs on. Some fund provider will eventually figure this out if LifeX or Tema haven't.

Tema has some interesting funds in the hopper coming soon too.

Krane Shares partnered with Hedgeye Asset Management to list yet another hedged S&P 500 ETF with symbol KSPY. The fund will buy put spreads below the market and sell calls above the market. For now, the put spreads are only 100 points wide so it's not clear that they would protect much against a serious whoosh down but the fund might be able to spread off differently when they feel it warranted. 

Another hedged equity ETF that I missed from a year ago is the JP Morgan Hedged Equity Laddered Overlay ETF (HELO). It also buys put spreads below the market but wider than with KSPY's initial positioning, and sells calls. The differentiation is that it staggers the expirations of the options by just a little which they believe will allow for more upcapture of the market cap weighted S&P 500 than other option strategy funds.

I saw a reference to HELO being identical to Simplify Hedged Equity (HEQT). That seems about right and in HELO's lifetime both it and HEQT have had better upcapture than JEPI.


Valuation as a tool for timing anything has a lousy track record.


I write frequently about needing to move the 40, or whatever percentage away from bonds with duration. That call has been correct for a while and we'll see if it stays correct or not but it is based on an attempt to understand what is happening in the present and then trying to understand greater risks going forward. The greater risk going forward to bonds with duration is that they continue to be unreliable sources of volatility, less able to effectively diversify portfolios. 

Not quite a year ago, we mentioned the Cyber Hornet S&P 500 Bitcoin 75/25 Strategy ETF (ZZZ). As the name implies it allocates 75% to the S&P 500 and 25% to Bitcoin. In that old post, I posited that anyone would probably be better off building it themselves, 75% to an S&P 500 ETF, 25% to a Bitcoin fund. 


Building it yourself is a simpler expression of the idea. It blends together, in this case, two simple fund that each have fewer moving parts than the multi-asset version. Obviously there are no absolutes on this point, client and personal holding BLNDX as one example, but always explore the simpler path when there is one. 

Finally, here's a link to a CNBC interview with Michael Saylor about how he is exploiting Microstrategy's balance sheet to buy more Bitcoin. The simple version the company is issuing convertible bonds with a zero percent coupon and taking the proceeds to buy more Bitcoin. The stock keeps going up so the bonds convert to common. It works, as long as Bitcoin goes up at a faster rate than they are diluting their common stock. Look out below if Bitcoin ever goes down by 80% again.

The interview itself was wild. Saylor always talks very fast and he hit the interviewer, Andrew Ross Sorkin, with an avalanche of jargon, on purpose I suspect, that no journalist could reasonably be expected to understand. I didn't understand it, I don't know if it was real or complete nonsense. I'm sure what they are doing is legal but I don't know how it's legal.

A small company called Semler Scientific (SMLR) is trying to take a page from Microstrategy's playbook if you are curious and want to learn more.

The information, analysis and opinions expressed herein reflect our judgment and opinions as of the date of writing and are subject to change at any time without notice. They are not intended to constitute legal, tax, securities or investment advice or a recommended course of action in any given situation.

Monday, November 25, 2024

Seeking Simplicity

I wanted to see if there were any momentum equity factor funds that were trading through the Financial Crisis. The momentum funds I am familiar with were not around back then. The Invesco Dorsey Wright Momentum ETF (PDP) started trading in March 2007.


In the 10 months ending at the low on March 9, 2009, you can see it was down a little worse than the S&P 500. From it's peak of $26.23 on 10/31/2007 it went down $10.73 on 3/9/2009.

Here's how three momentum funds including PDP did during the 2020 Pandemic Crash.


That's only month end data for February and March of that year. If you eyeball the same info on the Yahoo chart, it's clear SPMO did better by 300-400 bp but you can't get exact percentages. Here's the slower decline of 2022.


And here's the year by year of all three compared to the S&P 500 for as far back as we can go.


Momentum funds are not a panacea. SPMO has consistently outperformed but can't always be counted on to do so. PDP has had a couple of good years, been close either way a couple of times but has had two, possibly three, real stinkers. MTUM isn't bad but isn't too inspiring either. 

All of that about momentum is a preamble to an exercise to create a portfolio that is a little simpler than we've been looking at lately but that hopefully has robust outcomes. You can decide whether these achieve that objective or not.

The names of the portfolio have the equity exposures but all three weight 50% simple equity. All three have 15% in Standpoint Multi Asset (BLNDX) which ostensibly brings in managed futures but I think thinking of it as all-weather, which is how they position the fund, might be more accurate. There's 30% split evenly between three different absolute return-type strategies (horizontal lines that tilt upward). The three don't really matter, the point is picking strategies that deliver the same type of result in completely different ways. All three though are single strategy, there's very few moving parts so they're easy to understand. Finally there's 5% in BTAL which is primarily a first responder defensive fund but has also delivered second responder attributes too. 

Although not included in the back test, I would think about 1% into asymmetry like maybe Bitcoin. Backtesting Bitcoin doesn't work very well. If we start when BTCFX started trading, it would add nothing because it went on a roundtrip to nowhere through October 31. It might look different after we get November data added to Portfoliovisualizer. If we use spot Bitcoin, that throws in a 305% lift in 2020 that may not be repeatable. 


Portfolio three includes a defense contractor for some alpha in certain types of crises. I've owned NOC for clients for 20 years so I just stuck with that one. I've talked about CBOE plenty. I believe it's a muted proxy for the VIX because that is where the VIX complex trades so it is a way of sneaking in a little long volatility exposure. VIX funds are first responder defensives but the bleed of most of them when there's no crisis is pretty rough. 

For a little more color, NOC is not currently in SPMO and CBOE only has a 0.13% weight so not much duplication. These two names are not my favorite stocks, I don't think I have favorites, I own them and included them today for the attributes I think they deliver.


Over the long term, they've done well which of course I'm thankful for and they are a great argument for ergodicity, but is is clear from the chart that they are capable of lagging for long periods of time especially toward the middle of the chart and this year for NOC. Nothing can always be best. 

The respective Calmar Ratios for Portfolios 1, 2 and 3 are 0.96, 0.69 and 1.42 versus 0.17 for the S&P 500. For Calmar, higher is better. The respective Kurtoses are -0.70, -0.19 and -0.41 versus -0.05 for the S&P 500. For Kurtosis, lower is better. 

You can play around with the idea and come up with other ways to get a similar output but I think of this as mostly simple tools to get what looks like a pretty robust back test. The risks include some sort of hideous run for SPMO for whatever reason (specifically not trying to guess what would cause that). Any of the absolute return vehicles could have something bad happen but I did diversify them such that it would be extremely unlikely that something bad happened to all three at the same time. The way BLNDX is put together, the risk is more like a very bad short period, which has never happened in almost five years of trading, as opposed to a multi year, serious fall off. 

Since I didn't mention it elsewhere, BLNDX and BTAL are client and personal holdings.  

The information, analysis and opinions expressed herein reflect our judgment and opinions as of the date of writing and are subject to change at any time without notice. They are not intended to constitute legal, tax, securities or investment advice or a recommended course of action in any given situation.

Sunday, November 24, 2024

Sunday Mashup

I had the weekend off from any fire department activity so I had extra time for some reading and research and found some interesting stuff.

AQR had a short paper defining/exploring different types of arbitrage in support, I believe, of the AQR Diversified Arbitrage (ADAIX) which combines convertible arb, merger arb and AQR includes event driven too. This quote was especially interesting. 

Merger arbitrageurs earn a liquidity premium by stepping in to buy shares from these investors, effectively selling insurance against deal failure.

So merger arb is a variation of risk transfer? I'm not convinced but it is an intriguing thought. Catastrophe bonds are an example of risk transfer.

Quantica had a paper about how to weigh trend following during lower interest rate regimes versus higher interest rate regimes. The TLDR is in low rate regimes, in the context of a 60/40 portfolio, they found 55% equities, 35% fixed income and 10% trend to be optimal. In a higher rate regime, they found 55/25 and then 20% in trend to be the sweet spot. 

A big part of their conclusions have to do with correlations between equities and fixed income changing depending on interest rate levels. 

I would chip in a point I make frequently which is that with T-bill rates higher, the cash held to collateralize the futures is yielding more. T-bills yield in the low fours these days versus single digit basis points a few years ago. Everything else being equal, that's close to 400 basis points of extra return accruing to the fund. Managed futures is struggling this year and I think it is far more about choppiness of markets than having anything to do with rates, by their work we should have more in managed futures these days. 

Did managed futures do so well in 2022 because of the correlation between stocks and bonds or because yields went up quickly and steadily so maybe the various managed futures funds were simply on the right side of the trade? That is refutable though because interest rates went down steadily for many years in the 2010's but the strategy did poorly. I think it's much simpler to think of managed futures as a "second responder" to a crisis or deep decline.

The line between diversifier and core holding is probably debatable. 10% may not be enough to be a core holding (debatable) but 20% into a strategy or asset class makes it a core holding, not a diversifier. 

Here's a story about successful aging from Walker Fire. A former firefighter and chief is our station boss and also knows how to fix just about everything. Station boss means he coordinates certain aspects of calls for service like setting up when we need a helicopter to land at the station, he keeps track of who is on the call and in what vehicle and a couple of other things. He's 81 and is no stranger to crawling under trucks or climbing up on top of them. 

We had a call for service on Friday for a HAZMAT, it was propane leak. When a call for service comes in, part of my initial process is to see who responds over the radio that they can come to the call, know what their training level is and figure out what vehicles to take based on the details of the call and who is responding. Because it was a HAZMAT of unknown severity, Prescott Fire (one of the big career departments here) was also dispatched.

The station boss asked me over the radio which vehicle he should pull out (he lives right behind the main station so he's always the first one there). Knowing Prescott was sending an engine and that two of our firefighters were responding from one of our substations in one of our engines, I said that I was just going to stop by the station to pick up my turnouts (structure fire PPE which is appropriate for this type of call) and take the command vehicle that is kept at my house. 

When I pulled in, I was expecting to run to the back of the station house, where we store the turnouts, but my bag was on the driveway waiting for me and the station boss was pulling an SCBA (air tank) off of the engine at the main station house for me to throw into the back of the command vehicle. 

A bag of turnout gear easily weighs 30 pounds, maybe 40 pounds and my bag is on the top shelf in the back because I'm kind of tall, and the station boss is pretty short. Not sure how he got it down, but he did. We keep the SCBAs in very large Pelican boxes, they are similarly heavy and again, he got it off the truck for me no problem. I wasn't expecting any of this, he just did it. 81. I was very impressed. 

I think mentioned this in another post, but if you're on Blue Sky, hit me up. 

The information, analysis and opinions expressed herein reflect our judgment and opinions as of the date of writing and are subject to change at any time without notice. They are not intended to constitute legal, tax, securities or investment advice or a recommended course of action in any given situation.

Friday, November 22, 2024

ETF Friday

The FT dug into the coming Bridgewater Risk Parity ETF. There was a little bit of humor and they raised good questions. It seemed like they believe there is a way to make it work while admitting that the strategy has struggled in recent years. The plainest vanilla explanation is that bonds are leveraged up so that the leveraged bond position has the same "risk," although volatility might be a better word, as the equity exposure. A more real world implementation is there are several asset classes involved and where the relationships between the assets are dynamic, so too should the allocations to the assets be dynamic. 

We've looked many times at the Risk Parity ETF (RPAR). It doesn't do well and maybe part of the story there is that the fund is indexed. As I read the FT article, I had a thought about how to try to make the fund work as part of diversified portfolio, not the entire portfolio. 


The idea here is to look to see if any value can be added. The way Portfolios 1 and 2 are weighted, the math works for being a 60/40 portfolio and then from there we add portable alpha/capital efficiency/return stacking. Portfolio 1 looks at whether putting the leftover 20% in T-Bills adds anything. Portfolio looks at adding managed futures and client/personal holding BTAL. Portfolio 2 adds some basis points of CAGR versus VBAIX but that comes with a larger increase in volatility. Portfolio 2 has pretty much the same Calmar Ratio as VBAIX but has a bit better Kurtosis. So, could this be a way to use RPAR? You can decide for yourself but as for me,


One of the Bloomberg premarket emails on Friday pondered "Is There Any Reason To Diversify?" The context was whether to just leave it all, meaning all, in domestic equities. Ok, well that's not the sort of thing you read when markets are fearful. When anyone talks about staying the course, they usually mean when markets are declining and people are fearful. The question of just going 100% US equities is the exact same thing, considering deviating from the course as a function of emotion, greed now, is a terrible idea. 

I've mentioned my involvement with a local foundation that awards grants to non-profits. I'm a research volunteer. In late 2021, when things were going well in markets, they brought up whether they should start to give out a higher percentage every year. My input was something like "no, no, oh my God, no." It's the same behavior. It takes discipline to stick to whatever strategy you chose for yourself as being best when emotion wasn't playing a factor. If anything, the good feeling of equities doing very well could be a time to derisk a little. Not sell down a lot of equities, just derisk a little. 

An interesting, new (to me) ETF popped up on my radar. The Horizon Kinetics Inflation Beneficiaries ETF (INFL) started trading in early 2021 and already has $1 billion in AUM. You can read the boilerplate here but basically it tries to isolate companies that can raise prices in an inflationary environment but not be forced to do so because their costs went up. 

The holdings include land companies, commodity streamers and four different publicly traded exchange stocks that total a little over 11% of the fund. I've owned at least one exchange for clients going back more than 10 years, I'm a pretty big believer in that space. Obviously the fund is heaviest in energy and materials combining for 57% but there doesn't appear to be any megacaps from either of those sectors.

With a fund like this, it would make sense to assess how buying the fund would impact the sector weightings of the entire portfolio. For example, if someone put 30% into this fund (it's just an example), that would add a little 15% of natural to the portfolio. That's a big weighting compared to the S&P 500 which may not be bad but not knowing there is such a big overweight would be bad.

So does it work?


Well yeah, maybe it does. It certainly had a relatively good 2022 when CPI jumped 8%. I threw RAAX in there since we mentioned it earlier this week. It is also doing very well in 2024, it is 1100 basis points ahead of the S&P 500. INFL equaled the S&P 500 in 2021 and lagged it badly in 2023. It has a 0.78 correlation to the S&P 500 compared to 0.70 for RAAX. INFL's beta is 0.82, the Calmar Ratio is a little higher (better) than the S&P 500 and the Kurtosis is a little lower (better) than the S&P 500.

It's interesting and has some differentiation. I think it's probably worth following.

The information, analysis and opinions expressed herein reflect our judgment and opinions as of the date of writing and are subject to change at any time without notice. They are not intended to constitute legal, tax, securities or investment advice or a recommended course of action in any given situation.

Thursday, November 21, 2024

Nouriel Roubini Enters The ETF Fray

Nouriel Roubini is one of the managers of the newly listed Atlas America Fund (USAF). The fund doesn't appear to capitalize on doom and dismay (funny if you know who Roubini is) but more like offer a little protection or diversification or both when there is doom and dismay.

From the fund page: the goal is seeking stable returns across a variety of economic and financial market conditions, consistent with the preservation of capital. Offering diversified exposure to U.S. Treasuries, real estate, gold, and agricultural commodities..."

There's no fact sheet yet and while the holdings are available, the asset allocation is vague without calculating the spreadsheet yourself which I did (hopefully correctly). It looks like 55% in treasuries which includes 5% in the Direxion Daily 20+ Year Treasury Bear 3x ETF (TMV). The duration of most of the long treasury exposure is pretty short so the position in TMV is a huge hedge. USAF has a little over 16% in gold, 7.5% in agricultural commodities and 13% in REITs. 

I backtested it with a couple of tweaks to be able to get a decently long period to study.


The reason I put RAAX in there is that I saw on Twitter that someone said it sounded like that fund. I don't know that fund but, based on the name...why not? I threw in 50% stocks/50% managed futures because that is viewed as being all-weather-ish.

The USAF backtest and RAAX don't really look too similar to me. RAAX is much more volatile. The USAF backtest is a horizontal line that tilts upward. It did decline about 5% in the 2020 Pandemic Crash and in 2022 it was up 1.36%. In the period studied, CPI compounded at 2.5% per data from the Minneapolis Fed while the USAF backtest compounded at 5.29% with a only a 4.10% standard deviation. The Kurtosis was -0.32 right in line with the 50/50 we backtested but oddly, the Kurtosis was inferior to RAAX. The Calmar Ratio was surprisingly high at 2.18.

Jason Buck sat for the Algorithmic Advantage podcast. Not much was new but he did say that Ray Dalio’s holy grail of 15 uncorrelated return streams doesn’t exist. I put together the following that just looks at 2022, when investors needed the uncorrelated streams;


There are 15 different return streams there in addition to VOO and VBAIX. It's just a sampling, you can decide for yourself whether they are collectively uncorrelated enough to be "15 uncorrelated return streams." I'd say it's pretty close. There's no way to fit that many into a portfolio without having a portfolio of diversifiers hedged with a little bit of equity exposure which I don't think would be optimal. There are plenty of diversifiers though to choose from if you believe in this type of exposure. PPFIX, MERIX and BTAL are client and personal holdings.

A reader left an interesting comment about the challenge of having even a small position in managed futures in periods, like last year and this year, where the "protection" turned out to be more of a drag because stocks went up so much. It has been challenging as we've talked about in other posts recently but I believe the 2010's were even worse. Check out the following.


To my knowledge, RYMFX was the first managed futures mutual fund and it had the space to itself for several years after in launched in 2007. The backtest runs from the start of 2011 to the end of 2020. Plenty of other managed futures funds came onto the scene in 2013 and 2014 but I think RYMFX is the only one to test what was a terrible time for managed futures. And since the other funds came along, RYMFX has shown to not be such a great representation of the strategy even though it helped in 2008.

In the period studied, RYMFX compounded at a negative 1.55%. I'm never going to want 50% or even 30% in managed futures but the point of the back test is that in about the worst stretch in the strategy's history with a huge weighting in a fund that is meh at best and the results ok. 50/50 still compounded at better than 9%. In that same period, the CPI compounded at 1.83%, again per Minneapolis Fed data. A 7% real return for 10 years doesn't suck. 

Bloomberg reported that Citron Research is short Microstrategy (MSTR) because the company has essentially been turned into a Bitcoin hedge fund. Um ok, but MSTR started buying Bitcoin in 2020. 


The news pasted the common and nuked the 2x version into the close of regular trading. After hours they are both bouncing back some. When something goes parabolic, it is a good bet it will revert to some sort of mean but the odds of getting the timing right are pretty low. Maybe they are short in a way where they started small and can scale in.

The information, analysis and opinions expressed herein reflect our judgment and opinions as of the date of writing and are subject to change at any time without notice. They are not intended to constitute legal, tax, securities or investment advice or a recommended course of action in any given situation.

Wednesday, November 20, 2024

When The 4% Rule Isn't 4%

Bill Bengen, known for deriving the 4% rule sat for a podcast with Sam Dogen, a well known FIRE proponent and blogger. The 4% rule is generally the accepted standard for a safe withdrawal rate in retirement to ensure the assets last for 30 years. Listen to the podcast. Their conversation was very illuminating. Get ready to be very surprised. 

Bengen retired as a financial advisor in 2013 but he also considers himself a researcher. The process to do the work to come up with 4% sounded very labor intensive. He basically ran the numbers for someone retiring in 1926 and then each each up into the 1970's. The worst case scenario was the cohort that retired in 1968. The safe withdrawal rate for that group was 4.3%. The way Bengen described it, 1968 was so bad that it skewed the entire study. By his work, there were plenty of 30 year retirement periods in his study where 7% was sustainable (listen to the podcast). There were quite a few years where double digit withdrawals would have been sustainable. I've mentioned before having a couple of clients who've been taking out 10 ish percent, one for 20 years and the other for 18 years. The first client will make it just fine unless something hideously expensive happens but I am less certain about the second client. 

The 4% rule (7% rule maybe) has a built in cost of living adjustment that Bengen thinks is very important. I've been dismissive of that part of the rule. The growth of the portfolio takes care of that. If someone has $930,000, they take out $37,200 that year but with asset appreciation the account goes up to $958,000 and they take out $38,320 the following year, there's the inflation bump but Bengen views it differently. 

One element that I've touched on before and think is crucial to understanding sustainable withdrawal rates that did not come up is not that 4% necessarily pushes the boundaries of sustainability but it creates some flexibility for the times that something very expensive comes up and needs to be addressed. Not quite a year ago, we had a problem with our septic system that was quite expensive as one example. A client recently told me about a roof problem they have that will be very expensive. These things happen and not maxing out the withdrawal rate can help when these things inevitably come along.  

4.3% was considered safe for the worst case scenario as I mentioned. Now, Bengen says the worst case has bumped up to 4.7%, I'm not sure I'm on board with that (listen to the podcast). Where Sam writes about FIRE, he asked Bengen what a safe withdrawal rate would be for someone who retired, planning to need the money to last for 50 years instead of the typical 30 used for planning purposes. He said 4.3% which Sam then worked through to come up with a path to people being able to retire much sooner than they typically plan on. Bengen said that would probably work but added that would be an awfully long time to just sit around watching television. 

A little more philosophically, about the idea of retiring early, Sam asked how hard and for how long should you work for money you'll never be able to spend? This was another rhetorical device to further the discussion about FIRE. Have you ever thought of it that way? I never have so I think it is an interesting question. 

Bengen at 76 years old is far from sitting around watch television. Among other things is working on a book that is almost complete that sounds like will update the context around the 4% rule. He lives in Arizona coincidentally.

For a little levity, I am pretty close to the midwit on both of these. 


And a personal note, Walker Fire needs to replace it's Type 1 engine. We have one board member and two firefighters looking. When they find something, they send it to me and I spend a little time on whether it is worth showing to the head fire mechanic of one of the large departments in the area (they are great about helping us with this sort of thing) and then whether to get to the point of a physical inspection. 


I took the above picture in 2017. It is now for sale and today I spent time going through it (virtually) to decide whether to pursue it or not. The answer is no but I feel like there's a lesson in here somewhere.

The information, analysis and opinions expressed herein reflect our judgment and opinions as of the date of writing and are subject to change at any time without notice. They are not intended to constitute legal, tax, securities or investment advice or a recommended course of action in any given situation. 

Tuesday, November 19, 2024

Crazy Or Brilliant?

The TLDR answer to the title is a little of both. 

There's a new ETF provider called FIRE Funds that target the Financial Independence/Retire Early movement, aka FIRE. For now, they have two funds, FIRE Funds Wealth Builder ETF (FIRS) and FIRE Funds Income Target ETF (FIRI). Whether they actually have anything to do with FIRE is less interesting than the allocation ideas. We'll see how they work going forward but I do believe a lot of effort went into constructing these and that's worth exploring. 

The page for FIRS says "FIRS seeks long-term capital appreciation and diversification across four strategically constructed ETF baskets that align with Prosperity, Recession, Inflation, and Deflation conditions." So it is permanent portfolio inspired. It has a lot allocated to gold and Bitcoin. 

Here is the full constituency.


There are very few familiar names in there. I read something in there somewhere that the FIRE Funds will try to use funds from Tidal, a white shoe provider, where possible which is why so many of the names are unfamiliar. Some of the funds are brand new, so new that backtesting doesn't really work so I made a couple of tweaks which gets us a year to look at. That is still very short but better than a couple of months. 


I compared it to the Permanent Portfolio Mutual Fund (PPRFX) and Vanguard Balanced Index Fund (VBAIX).


I built it without reinvesting dividends on the presumption that if someone was living off this in early retirement they'd be pulling some amount of money out. In the period backtested, it paid out a little over 5%. There was no Calmar Ratio information but the FIRS backtest had a Kurtosis of -0.02 compared to -0.57 for PRPFX and 0.51 for VBAIX. For Kurtosis, lower is better. 

FIRS has a lot of complexity, really a lot, but the result seems in line and if it can sustainably kick out a 5+/-% yield in a 4% world with decent upcapture, that sounds pretty good.

FIRI has a couple of different challenges. Here's the constituency of that one.


It has about 26% in very high yielding derivative income funds, highlighted in yellow. GDXY has only been around since May but its payout annualizes out to 32% and price only, it is down 20% since it debuted. Yahoo Finance shows QQQY yielding 93% and down 45% on a price basis since it listed 14 months ago. ULTY listed in February, the yield annualizes out close to 60% and the fund is down 50% price only. XOMO yields 23% and for one year it is down 7% in price terms. YBIT's yield annualizes out to 54% and in price terms it is down 23% since it listed in the spring. Bitcoin is up 43% since YBIT started trading. Extrapolating an annual yield is not rigorous but paints a good enough picture for a blog post.

YieldMax talks about the importance of reinvesting the dividends their funds pay out. These extremely high yielding ETFs are not going to be able to keep up with their dividends. We'll see how that plays out for FIRI but the prospectus says it targets a 4% annual income level. 

It looks like the fund will yield quite a bit more than that based on the holdings. FIAX yields 7% per Yahoo Finance, MSTI is north of 5%, SPAX yields almost 8% and VETZ yields 5% and the very high yields of the derivative income funds. FIRI too might be a situation where any payout north of maybe 5% should be reinvested to offset the price erosion. 


The backtest is true to the current makeup of FIRI so it only goes back to June but in just five months it is down just over 6%. On a total return basis, it is up 1.99%. I'm less confident in this one but maybe once it has a year under its belt it can put in a good showing. 

And in other ETF news, Bridgewater is partnering with StateStreet to package Ray Dalio's All-Weather Portfolio into an ETF. All Weather is a variation on risk parity which as we've looked at many times and has been difficult to make work in an ETF or mutual fund. The default Dalio All-Weather is prepopulated in Portfoliovisualizer as follows. 


Here's how it has done compared to 50% equities/50% managed futures (another version of all-weather?) and VBAIX.


The bond allocation has of course hurt the portfolio very much. I couldn't find the prospectus for the proposed All-Weather ETF but the Bloomberg link says that Bridgewater will deliver the model that StateStreet will implement. Where Portfoliovisualizer has a static allocation, it sounds like this new SPDR ETF will not be static. I will keep an eye out for a prospectus or if you find the link, please leave it in the comments. 

The information, analysis and opinions expressed herein reflect our judgment and opinions as of the date of writing and are subject to change at any time without notice. They are not intended to constitute legal, tax, securities or investment advice or a recommended course of action in any given situation.
Monday, November 18, 2024

What Were You Expecting?

One of the pre-market emails that Bloomberg sends out included a passage on Monday morning noting that 96% of all ETFs are up in 2024 which is a very high percentage. Many ETFs are up a lot of course but "popular gauges tracking hedge-fund returns are scoring much smaller victories." The article goes on to say "higher-fee strategies have proved too complex for their own good" implying long short funds generally but without naming names which was disappointing. 

This is a point we have hit on many times in terms of understanding what a fund is trying to do and how important it is for holders to have the correct expectations. 


The blue, red and yellow on the bar chart are all alts that we talk about regularly on the blog, none of them are inverse funds. They are all intended to go up when stocks go down. They should have a negative correlation to equities far more often than not. Nothing is infallible, but I believe they are reliable. VBAIX, the green bar, is going to go up most of the time including three out of four years on the bar chart. The three alts looked nothing like VBAIX in 2022 which was a good thing and they look nothing like VBAIX in the other years which is the challenge of having huge allocations to negatively correlated alts and why I talk all the time about small exposures to diversifiers. 

At a high level, I want small exposures to the blue, red and yellow to help smooth out the ride of my large exposure to the green line. 


The second bar chart is comprised of alts that are intended to be horizontal lines that tilt up no matter what is going on and they generally do that but they are not infallible. In 2022, the red bar was down 54 basis points. Of course it would have been better for it to have been up a little but that sort of decline is far from a failure compared to expecting up a little and it dropping 25%. 

The Bloomberg note might have been referring to the type of funds that go for alpha no matter what and that can be a difficult way to make a living. There must be some funds out there that are always up and reliably beat the market but even then, that is a tough thing to rely on going forward. A more realistic expectation for equities is the likelihood of lagging some years, outperforming in other years and hopefully capturing most of the effect over the longer term.  

The information, analysis and opinions expressed herein reflect our judgment and opinions as of the date of writing and are subject to change at any time without notice. They are not intended to constitute legal, tax, securities or investment advice or a recommended course of action in any given situation.

Sunday, November 17, 2024

A Fund That Is Both Intriguing & Puzzling

Barron's had an article about Bill Ackman's closed end fund that trades in Amsterdam but is on the US pink sheets with symbol PSHZF. This post is not about that fund. There was a quote in there from Eric Boughton, one of the managers of the Matisse Discounted Closed End Fund Strategy (MDCEX). Matisse has a couple of funds of closed end funds that we've looked at before.

Closed end funds (CEF) have a fixed* number of shares. They have a net asset value (NAV) per share but because the number of shares is fixed, the market price that closed end funds trade at can vary significantly from the NAV. For quite a few years now, many (most?) CEFs have traded below their NAV, so a discount to NAV. There was a stretch many years ago that I recall a lot of them were trading above their NAV which is referred to a a premium. Fixed* in that there is no daily creation/redemption process but funds can go through a process to issue new shares via secondary offerings. 

CEFs tend to have very high yields because they usually use leverage. The basics are not so difficult to understand but there is a lot of nuance to the space in terms of certain investors or funds, Matisse, Herzfeld Advisors and Saba Capital as some examples, trying to game the discount/premium dynamic along with some other strategies.


The chart is of three very long standing CEFs and isolates one of the challenges of owning closed end funds. The charts are price only but captures the erosion that often goes with owning CEFs. On a total return basis, the compound positively but they can't keep up with the payout. 

According to Morningstar, JPC is trading at only a 0.12% discount to NAV, PPT is trading at an 8.14% discount and MIN is trading at a 3.96% discount. For what it's worth, JPC had been at a 4% discount until very recently. The respective yields of the three funds are 9.9% with 38% leverage, 9.02% with no leverage information provided and 8.91% with 23% leverage.

That all tees us up to try to figure out MDCEX. And I do mean try to figure it out because I really don't know what to make of it. MDCEX is in Morningstar's Tactical Asset Allocation (TAA) category and the Fidelity info page for the fund offers the following comparison to other funds. 


MDCEX has had the highest returns but it appears to have been more volatile. Here's a comparison I built. The returns are competitive but the volatility is much higher.


MDCEX' Calmar Ratio was the essentially same as PRPFX and a good bit higher than VBAIX, higher is better. And its Kurtosis was off the charts high compared to the other two which is not good. High volatility and higher probability of bad outlier return (Kurtosis) don't have to be negatives if the correlation is low or if you have some reason to believe it could offer some sort of first or second responder defensive attributes but MDCEX's correlation to the S&P 500 is 0.86 and it has a downside capture of 88%. 

Looking at how it has actually traded though, yes more volatility and you can see in the chart it got pasted in the 2020 Pandemic Crash (poor first responder?) falling 36% but in 2022 it was only down 6.5% so maybe there's hope as a decent second responder? Regardless of whether 2022 was a matter of luck or skill, down 6.5% in 2022 is a solid result. The question though is whether there is any basis to believe it could do something like that again.

Since it's inception, according to Arch Indices portfolio tool, MDCEX has compounded at 8.62% versus 9.06% for VBAIX and 5.78% for PRPFX. VBAIX and PRPFX are both core holding types of funds and while Morgingstar puts MDCEX into TAA, I'm not sure that is a great fit. MDCEX as a core holding, the return is decent but the stats say it is very volatile and the Kurtosis number is truly awful.

Can it add value as a diversifier, more in line with the TAA category? I built out the following to backtest where the only difference is a 20% allocation to MDCEX or iShares Aggregate Bond ETF (AGG). BTAL is a client and personal holding.


Portfolio 3 is 50/50 S&P 500/managed futures and the benchmark is Vanguard Balanced Index.

The return is higher with MDCEX but so too is the volatility. The Calmar Ratio with Portfolio 1 is ok at 0.84, better than Portfolio 2 and VBAIX. Interestingly, 50/50 S&P 500/managed futures has a Calmar above 3 which is very good. Portfolio 1's Kurtosis is pretty bad at 2.47. That's not off the charts but it's high. I played around with some similar variations of Portfolio 1 and couldn't get the numbers to change much, good performance with a lot of volatility. 

Maybe not rigorous study, but if you shorten the time frame of any of the above to start after MDCEX fell 36% in the 2020 Pandemic Crash, the Kurtosis comes way down. The outlier of 2020 has really pounded this metric for the fund but if it happened once, could it happen again?

Top holdings per Fidelity


Simple to understand return attribution.


The expense net to fund holders is very high. The management fee seems in the ballpark at 0.95 but there are things like fees of the CEFs it owns, including very high fees for the Ackman fund mentioned above, that need to be considered and adds up to 3.84%.

The idea of what Matisse is doing is very interesting me, I've been intrigued by CEFs since the 80's but it has been ages since I used any for clients or owned one personally. I don't think it is a bad fund, yes very expensive, but I think there is something to learn by following it even though I am very unlikely to ever buy it.

The information, analysis and opinions expressed herein reflect our judgment and opinions as of the date of writing and are subject to change at any time without notice. They are not intended to constitute legal, tax, securities or investment advice or a recommended course of action in any given situation.

Friday, November 15, 2024

Prepping For The Tyson Fight

Some quick hits tonight ahead of the Tyson fight, if I can stay up that long.

Meb Faber posted this quote.


The stock market goes up far more often than not. If an investor does nothing they will capture that long term inertia. The more trading an investor does, the more they fight against that inertia. That's not to say never make changes, occasionally changes need to be made and even the occasional change could turn out to be "right" or "wrong" which is fine, no one will get them all right and no one will get them all wrong but try to let the market work for you without fighting it. 

Next


This is something I made up for possible inclusion in the end of quarter letter I send out to clients. The blue line is obviously very smooth, an unvolatile ride. It would be great to have the portfolio look like that in real life but as a goal, you can see that it will have years where it lags by a lot. Seeing short terms lags on a backtest is one thing but enduring one is another. Do you have managed futures exposure? That is going through a pretty lousy grind right now but that doesn't mean it should be given up on. However, if you own managed futures through a mutual fund it might be worth selling in a taxable account until after the year end distribution. 

I saw the following on Twitter.


In his comments, Spencer replied to someone that he was specifically talking about the Risk Parity ETF (RPAR) not the strategy of risk parity. We've looked at risk parity many times. The concept is very intriguing but it has been difficult to own in a mutual fund or ETF wrapper. RPAR has done poorly and the Wealthfront Risk Parity Mutual Fund, which has done poorly too, just announced that it is closing. AQR had a risk parity mutual fund that struggled for a long time and then they changed the name of the fund and I believe they tweaked the strategy. AQR has other funds that maybe could be described as being a variation of risk parity but even if not, they appear to be influenced by risk parity. 

Cliff replied later in the comments that "I have no idea what RPAR is doing." There was another comment that I thought was worthwhile too. @StolpyStolps said "risk parity with just stocks and bonds isn't risk parity."

I'm on Bluesky if you're on there https://bsky.app/profile/randomroger.bsky.social

The information, analysis and opinions expressed herein reflect our judgment and opinions as of the date of writing and are subject to change at any time without notice. They are not intended to constitute legal, tax, securities or investment advice or a recommended course of action in any given situation.

Cash vs Bonds

Barron's looked at the merits of holding cash versus bonds which fits in here very well. The article was fine for the most part. It gen...