Friday, October 11, 2024

Uncompensated Complexity

Eric Crittenden sat for the Algorithmic Advantage podcast, it was about an hour and twenty minutes and covered a lot of ground. Crittenden manages the Standpoint Multi-Asset Fund (BLNDX/REMIX) which I've owned personally and for clients pretty much since the fund listed. 

There were some great points made to share and explore. The first point is that I think he validated a point I've been making for many years about managed futures and the importance of T-bill yields to the funds in the space. Most the of the managed futures funds are in treasury bills which collateralize the futures program. A question I raised more than ten years with a hedge fund data wonk was isn't yield on the T-bills a huge contributor? Yielding a half of a percent versus 4-5% would seem to matter a lot. I've been routinely told no when I've asked several people but I think Eric was saying it does matter, it is at least a useful contributor to the strategy.

The story behind the founding of the strategy underlying BLNDX and then the fund itself has a very long runway that you can check out for yourself on the podcast but the asset mix that led to BLNDX is what he thinks is the optimal portfolio based on many years of research. He believes it provides the best chance for an "acceptable" real return in all market conditions. That gives some good color on his use of the term "all-weather" to describe the strategy.

Eric also acknowledged how difficult it is to hold managed futures from week to week and month to month. This makes sense. It is a diversifier with the tendency of being negatively correlated to equities. Equities being the thing that goes up the most, most of the time, a strategy that tends to be negatively correlated to the thing going up most of the time will of course be difficult to hold. We appear to be in a stretch right now where that is true. Being difficult to hold probably applies to most alternative strategies which is a crucial building block for understanding what diversification really is. As Jason Buck has said, if you're really diversified then you have at least one holding that makes you want to puke. 

He articulated the asset mix of his optimal portfolio in a way that I hadn't heard him discuss before. BLNDX is 50% equities and then a range of managed futures of 50 to as much as 100%. But then he talked about T-bills being part of the mix too which of course they are and always have been. He didn't quantify the equities/managed futures/T-bill mix from his research so I took a guess and the results are interesting. 


The 25/25/50 blend did not keep up with BLNDX but it did offer a real return with very little volatility. Going back ten years, 25/25/50 compounded at 5.69% with a standard deviation of 5.73% versus 8.41% growth and a standard deviation of 10.27% for VBAIX. The ten year numbers for 50% VOO/50% AQMIX were 8.85% and 7.76% respectively. 

The most interesting part of the podcast was when he talked about getting rid of uncompensated complexity. This connects with two things we talk about here. First is my description of building a portfolio comprised of simplicity, hedged with a little complexity as well as assessing whether a strategy delivers on the expectation being set. The now closed Simplify Tail Risk ETF (CYA) blew up very quickly. I believe it was done in by the VIX portion of its strategy but either way I would say it never lived up to the expectation it set. Simplify has a fund that owns the S&P 500 with a put option overlay that somehow went down more than the S&P 500 in 2022. Same story, didn't meet expectations, these are examples of uncompensated complexity.


Above are two more funds that I don't believe meet the expectation they are setting, both compared to VBAIX. FIG, the blue line, "is a modern take on the balanced portfolio, built to help navigate today’s toughest asset allocation challenges." The Risk Parity ETF (RPAR), the pink line, "Seeks to generate positive returns during periods of economic growth, preserve capital during periods of economic contraction, and preserve real rates of return during periods of heightened inflation." Ok, how's that going? How soon before these should start to work? I don't know about FIG but I thin RPAR might have been an implementation of a successful backtest that did not look forward to see that bonds with duration were going to be a big problem. Typically, risk parity which is what RPAR is, loads up on bonds. 

Checking in on catastrophe bonds, I thought the following two screenshots would useful learning tools. First is sort of an asset allocation picture from the Pioneer Cat Bond Fund (CBYYX).


I'm a little surprised how much was exposed to Florida hurricanes but that is obviously where much of the threat lies. The next screenshot lists some of the positions in the Ambassador Fund (EMPIX) which I am test driving in one of my accounts for possible use for clients.

Two things to note here. Cat bonds are not really bonds in the manner most people think. They are T-bills with what amounts to a note or a rider bundled in to add up to a higher yield. The other thing is I highlighted the different reinsurance companies transferring the risk via the bonds. On other pages of the holdings there are duplicates of reinsurers but there is work done by the fund managers to try to diversify issuers. The funds are designed to spread the risk very broadly but obviously, anything can happen at anytime. The yields are high, there is a risk tradeoff to consider which is an argument to keep any sort of weighting small. 

Finally, if you're interested in the 351 Exchange I mentioned the other day where you swap your portfolio for shares in an ETF to capture tax efficiency, here's a good primer from Cambria who is looking to bring this to market. I got a couple of the conclusions wrong about tax basis and that there will be requirement to "buy in" with a diversified portfolio as oppose to just a position in low basis stock. It's not looking like I will have any clients for whom this makes sense but will keep trying to take in more information.

The information, analysis and opinions expressed herein reflect our judgment and opinions as of the date of writing and are subject to change at any time without notice. They are not intended to constitute legal, tax, securities or investment advice or a recommended course of action in any given situation.

Thursday, October 10, 2024

Spitznagel Is Not A Fan Of 60/40

Comments from an interview of Mark Spitznagel made the rounds. Here's a version from Bloomberg, Yahoo and Unusual Whales. The Bloomberg version has a short video, it was not the entire interview. Spitznagel runs the Universa Fund which is a tail risk fund. Regardless of whether he's talking his book or genuinely bearish all the time, he usually does a good job framing out the prevailing bear case. There is always a prevailing bear case. This time though, he wasn't that persuasive. It might have just been how the interview went, but he talked about complacency and a little about 2022.  

More interesting were comments about diversification being "deworsification," it's a "big lie" that has left people worse off. Ok! We've got something to chew on there. To the extent he meant diversifying with bonds, I can't get to it being a lie but clearly I've felt they no longer are anywhere near as effective as diversifiers. This a theme we've been working on here for many years. Bonds with duration went from insanely risky because of how low the yields were to now being unreliably volatile. Income sectors that avoid interest rate risk still work as far as I can tell. 

Spitznagel specifically says that diversification isn't the holy grail it's made out to be. I'm not sure, but that might be a shot at Ray Dalio's idea about having 15-20 uncorrelated return streams as being the holy grail of investing. 

I won't entirely rehash the last three years worth of posts to take the other side of his opinion. We've been on the case with negatively correlated return streams since before the Financial Crisis with inverse funds and RYMFX. Of course my understanding as well as the products available have evolved considerably. There is a long list of funds with strategies that offer negatively correlated return streams and uncorrelated return streams to diversify equity volatility. It turns out that a lot of those diversifiers are uncorrelated with each other. We've seen the general effect work in various types of adverse market regimes. 

Finding them is easy. They're out there and we've looked at them plenty. Figuring out the sizing is a nuanced process. I've said many times before, you do not want a portfolio of diversifiers hedged with a little bit of equity exposure. Equities are the thing that go up the most, most of the time and unless you're in some variation of game over you want equities to be your largest holding. Hanging on to diversifiers can be challenging too. It is very human to give up on something that seems to not be doing much but there is no way to know when they will be needed to carry the portfolio.

Checking in on the catastrophe bond mutual funds at Wednesday's prices.


Yesterday, I mentioned some quirkiness with mutual fund reporting. EMPIX was up on Tuesday and as you can see up on Wednesday. EMPIX has generally held up better so far but I don't draw any sort of conclusion from that. It doesn't track for me that the bonds are so efficient that we have a good picture of what is really going on days before we have a real handle on the damage. It might be weeks before the market knows. I'm not sure which is why I am tracking this and why I am test driving EMPIX in one of my accounts for possible use in client accounts. 

After I wrote the above paragraph I got some more information. One via email confirming what I said about it taking a while to sort out the true extent of the costs. It said weeks or even months. Both the email and this Bloomberg article reports estimates of the costs coming down quite a bit. In one blog post, I said that the dollar threshold for triggering events is usually very high. It is still not known whether there were any triggering events from Milton. It's a good bet there were but that hasn't been reported yet. For whatever reason, Bloomberg has had content about cat bonds every day through this which has helped tremendously.

Time got away from working on this post and so we now have Thursday's prices for the cat bond mutual funds, perhaps reflecting the sentiment of the Bloomberg article about the damage being less than the worst case scenario, dollar-wise.


On a related note, earlier this week I saw that the Brookmont Catastrophic Bond ETF (ROAR) did not issue when expected, It was supposed to hit the market during the summer but hasn't done so. I am not sure if it is merely delayed or not going to happen. It would have been interesting to see ROAR react during the trading days this week. It might have been instructive but as I said before, I don't think cat bonds are easily ETF-able.

The information, analysis and opinions expressed herein reflect our judgment and opinions as of the date of writing and are subject to change at any time without notice. They are not intended to constitute legal, tax, securities or investment advice or a recommended course of action in any given situation.

Wednesday, October 09, 2024

These Funds Still Don't Work

I'm a big believer in reiterating/repeating rules of thumb. It helps in many ways including avoiding poor investment decisions. Included in this series of reiterations is to minimize the use of complicated products and to size any holding appropriately. 

With complexity that is unnecessary, I'm going to again reference the ReturnStacked ETFs.


Quick editorial note, Yahoo 2.0 isn't quite ready but they appear to be going with it anyway. The blue line is the ReturnStacked Bonds & Managed Futures ETF (RSBT), the pink line is the iShares Aggregate Bond ETF (AGG) and the green line is iMGP DBi Managed Futures ETF (DBMF). We don't usually look at DBMF but I did today because RSBT uses a replication strategy for managed futures as does DBMF. 

A couple of points about this chart. It goes back to RSBT's inception. RSBT provides exposure to 100% AGG-like bond exposure and 100% managed futures replication. There's obviously no DIY combo of AGG and DBMF that would work out to a 13% decline. Yesterday, I mentioned that managed futures has been going through a rough patch. If DBMF has been an outlier to the upside during this rough patch and someone built a combo of AGG and a different managed futures fund, they'd probably want that small lift in AGG to benefit their account. Going heavy into RSBT, as these were once marketed, would deny that lift, small as it is, you'd rather be up 1.4% than down 13%. 

Part of my skepticism has been that the blend would deliver something different than, in this case, bonds with managed futures "on top." Looking closer on Portfoliovisualizer which doesn't capture the October decline:

These were built in the context that I think ReturnStacked is talking about now. Taking 100% of just the fixed income sleeve, Portfolio 1 is an implementation that makes sense in that it has 100% bond exposure with 20% managed futures "on top" using their fund and it lags. It seems like it always lags. I pick on these funds, yes, but man I don't see it. The track record isn't long, I understand that but it's not getting better. 

I was going to say that the picture is a little better with Return Stacked Stocks & Managed Futures (RSST) but maybe not. Again, apologies for the chart, RSST is the blue line, the pink line is the Vanguard S&P 500 (VOO) and the green line is still DBMF.


If you're willing to be as volatile as the S&P 500 then you should probably get the return of the S&P 500. RSST has a standard deviation that is 127 basis points higher than VOO and you can see that it has lagged. If you agree with me that managed futures tends to have a negative correlation to equities then the above price result makes sense. This differs from what client and personal holding Standpoint Multi Asset (BLNDX) is trying to do. RSST is stocks with managed futures on top and the result is more volatile with lower returns. BLNDX targets an all weather result and a lower standard deviation. All weather is not seeking equity beta plus....which is what RSST is trying to do. The expectations being set for each one are different. You can decide for yourself how well each one is delivering on its expectations. 

Checking in on the catastrophe bond mutual funds as Milton continues toward Tampa and its Category rating vacillates between 4 and 5.


Yesterday, I said that mutual fund pricing on Yahoo is quirky sometimes. The price for EMPIX is stale and incorrect. Both Morningstar and MarketWatch have EMPIX up $0.10 to $10.21 on Tuesday. Yesterday, SHRIX was down 3.13% and somehow CBYYX was flat. EMPIX is a personal holding that I am test driving for possible use for clients.

Bloomberg had an article about cat bond investors bracing for "huge losses." This will be a good learning opportunity for me but the losses for cat bond holders may not be "huge." The thresholds where the bonds trigger are very high. Additionally, the way the mutual funds are constructed, they spread the risk around to disparate events. We'll see, maybe they will be huge but if not, the above explains why. The is a good opportunity to talk about position sizing. Here's a quote from the Bloomberg article.

Tanja Wrosch, head of cat-bond portfolio management at Twelve Capital AG, says if Milton hits Tampa head-on as a major hurricane, catastrophe-bond losses “will be more significant than from Ian.” The Swiss asset manager has a $5 billion portfolio, including $3.8 billion of catastrophe bonds.

Three quarters of Twelve Capital AG's assets are in catastrophe bonds? I looked up the firm, they specialize in ILS. That stands for insurance linked securities and it is an important one to remember because you'll see that acronym used all the time when you read about the space or study the funds. I looked up that firm and they specialize in ILS so being that heavy make sense. If you are running a huge pool of capital and want ILS exposure, you'd invest with them expecting ILS for that allocation.

At first read though, I thought yikes. I am in on cat bonds being an uncorrelated return stream, it has no correlation to primary assets or alternatives so that is useful. I haven't sorted out whether I think the risk to events like the Helene/Milton combo makes them a good hold or not. This is new enough for me, that I am learning what the risk really is. It's easy to read about this and get sold on the idea of a huge allocation, like return stacking. Like just about anything that is alternative, any exposure I might ever put on for clients to ILS would be mid-single digits at most. Both are very appealing intellectually one works in my opinion even if I don't end up using it for clients and one does not. 

Finally, the FT wrote about the apathy toward Ethereum ETFs. They listed in late July and immediately fell off a cliff (with the price of Ethereum of course). Since that decline it has traded volatilely but sideways. The flows into the ETFs has dried up with that price movement. I own a little of one of the ETFs for the potential asymmetry. I owned the original Grayscale trust for a while and then swapped into one of the ETFs. I have no idea if it will go to a bazillion or zero but whatever the outcome, the bigger lesson is being able to live with occasional boredom with some holdings or even the entire portfolio. There's a cliche about not shorting a dull market and while I'm not sure that applies, making changes just because you're bored is a bad idea. 

The information, analysis and opinions expressed herein reflect our judgment and opinions as of the date of writing and are subject to change at any time without notice. They are not intended to constitute legal, tax, securities or investment advice or a recommended course of action in any given situation.

Tuesday, October 08, 2024

Private Equity Needs Bag Holders Like You!

Some very quick hits. I mean it, very quick.

The title of this post came from the following image. Like with buffer funds, just don't with the private equity funds that appear soon to launch. While I am not interested in the ETFs comprised of private equity fund managers, those would be better than what's coming. If I am wrong, I'm wrong but they have bag holder written all over them.


Many details to come but Cambria and Alpha Architect are working to issue a fund where investors can exchange low basis, taxable investment portfolios for shares in this new ETF that will have the symbol TAX without it being a taxable event. This all falls under Rule 351 which you should research for yourself and with your accountant once all the details of the fund come out. When we've talked in the past about ETFs evolving to democratize access to sophisticated strategies, this wasn't what I had in mind but seems to fit the bill. If you have a couple million dollars worth of Microsoft you bought in the 90's, or earlier, at a minimum, I would tell you to learn about this. At this point, I have no idea if this will be a good thing or not but again worth investigating for the right circumstance. 

Precidian launched the first of what is slated to be many ETFs that own one ADR and hedge out the currency risk to create the effect of owning whatever company you buy as a local investor in that company's home market. I first heard about this a little over ten years ago. I know the idea as belonging to former Bank of New York executive Julio Lugo. I met him once during my time at AdvisorShares. He has since passed away. The product line is called ADRhedged

The difference between being exposed to the currency or hedged could be significant at times. The difference between Novartis ADRs (NVS) which is a client holding and the shares traded in Switzerland over the last year charted below. That seems like a big gap and the difference is accounted for by strength of the Swiss franc against the US dollar.


You can see a dollar rally in this chart from early 2024 into May as the two converged before the franc rallied again. Sometimes just owning the ADR will be right and sometimes holding the hedged version will be right. It would be difficult to have an edge here. If this makes your radar at all, pick one and stick with it. Personally, I want the currency exposure. 

Corey Hoffstein shared a thread about portable alpha which is an older term for return stacking. In one of the Tweets, that's right I said Tweets, he talked about 2008 being a disaster as correlations went to 1. The context from Corey about this was that the capital efficiency back then was usually allocated to long only managers who could outperform the indexes thus adding alpha. ReturnStacked ETFs differentiates by using the leverage to add exposure to diversifiers, not piling on the long equity exposure.

I think the only capitally efficient funds back in 2008 were the PIMCO PLUS suite including the PIMCO Stocks PLUS Long Duration (PSLDX) which leveraged up 100/100 stocks and long bonds. A 50% allocation equals 100% into a fully invested stock and bond portfolio leaving 50% for adding long equity as Corey says was common in 2008, diversifiers or just cash. Capital efficiency with diversifiers worked though in 2008.


In 2008 I owned MERFX, RYMFX and SH for clients so I think my using them for this post is credible. I did not leverage up with PSLDX but that is not something I am likely to ever do. In 2008, Portfolio 1 outperformed VBAIX by 697 basis points, down 14.66 versus down 21.63%. 

Bloomberg wrote about the "100% Yield" ETFs we look at here regularly. Obviously, this was about all the options funds that have it the market lately including single stock covered call funds and the higher yielding 0dte index funds and so on. It's a good read. What stood out to me was the anecdote toward the end, someone who was presented as some sort of professional investor who said he lost 40% on the YieldMax TSLA Option Income ETF (TSLY) but that fortunately it was only 1% of his portfolio.


How did he lose 40%? This is what we always talk about. If he lost 40% it's because he spent the dividend. If you have exposure to something that yields 30% or 40% or whatever these things yield and you don't reinvest the vast majority of the dividend, then yes, the size of the position will erode very quickly. There's not much to like on that screen grab from Portfoliovisualizer, but it's nowhere near a 40% loss. 

Managed futures funds are going through some stuff.


ASFYX is a client and personal holding. For not quite two years, stocks have been rocketed higher and after a great run, managed futures funds have it a wall and are struggling. This is probably going to become a theme we talk about for a while, same as MLPs and REITs right before the financial crisis. Well, not the same but similar. The volume of content in 2022 about having huge allocations to managed futures was constant, similar to suggestions of 20-25% into MLPs and REITs in 2006. 

I am a big believer in managed futures but one of the reasons to own the strategy is that it tends to have a negative correlation to equities, it tends to go up in years like 2022. Managed futures can absolutely do well at the same time as equities but it is a diversifier, I do not view it as a core in terms of portfolio weight. Yes for blogging purposes which are theoretical purposes, we use large weightings but I try to be consistent with saying to keep exposures small, to diversify your diversifiers in case something goes "wrong." I don't think something is wrong here, the space has done struggled before and for much longer periods than this. 

Finally, Helene and Milton are impacting the catastrophe bond space.

I'm not sure if CBYYX was really flat today, sometimes mutual fund pricing does weird things but this sort of weather event is a useful litmus test for seeing how this space navigates through something terrible. I've been test driving EMPIX for a little while to decide if I would ever use them in client accounts. SHRIX was the only fund in the space two years ago during Hurricane Ian (EMPIX existed but was not fully invested) and it dropped about 10%, reportedly ahead of time, pricing in the threat before the damage had been quantified. Not sure how far they will drop this time of course and more interestingly, if they will complete their decline before the extent of the damage is known. This example is exactly why I believe in test driving some of these. 

The information, analysis and opinions expressed herein reflect our judgment and opinions as of the date of writing and are subject to change at any time without notice. They are not intended to constitute legal, tax, securities or investment advice or a recommended course of action in any given situation.

Monday, October 07, 2024

GMO's Answer To 60/40

GMO posted a short paper in support of its Benchmark Free Asset Allocation Strategy (BFAAS). The paper positions BFAAS as a substitute for 60/40. GMO is most known for founder Jeremy Grantham, the G in GMO. Grantham perpetually calls out the bear case and while he gets that wrong most of the time, similar to people like John Hussman and Nouriel Roubini, he always has an interesting take on the prevailing bear case. There is always a bear case but markets tend to go up in spite of whatever the bear case of the day is. Understanding the prevailing bear case is important because no one's plans, financial and otherwise, get disrupted but everything going right. 

GMO is very much a value investing shop so a lot of what they talk about in the paper is how expensive US growth is so they devote effort to finding attractively priced equities elsewhere to slot into BFAAS. For this post we'll focus on BFAAS' asset allocation. Based on the stats, it's worth spending a little time digging in.


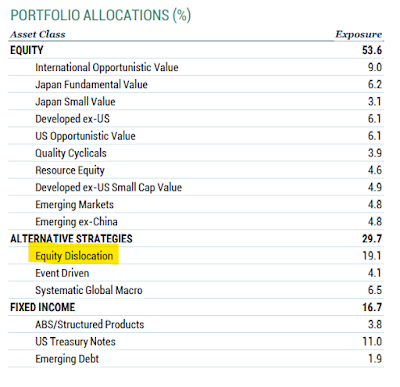
The asset mix is 53.6% to equities, 29.7% in alternative strategies and 16.7% in fixed income. A more detailed look at the asset mix shows the the following.

I highlighted "equity dislocation." That is a long/short strategy they run that seeks "returns from a narrowing of the valuation dislocation between cheap value stocks and egregiously expensive growth stocks." That sounds a little BTAL-ish. That fund goes short high volatility stocks and long low volatility stocks. BTAL is a client and personal holding. There's no qualitative value assessment with BTAL though so while I think it is similar, they aren't quite the same thing. 

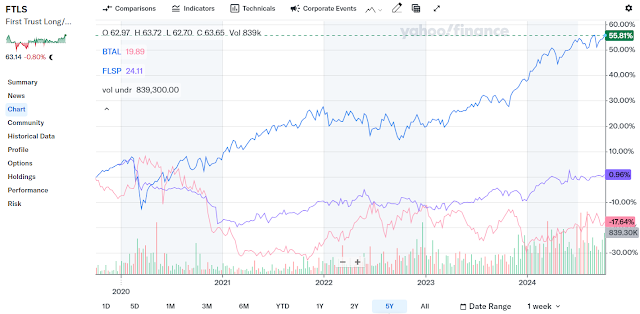
Long/short funds are tricky. It's a vague term that can mean different things as the chart helps explain.


All three are long/short funds but they have different objectives and comparing them to each other beyond simply trying to understand what they are trying to do isn't productive. First Trust Long/Short (FTLS) is up a lot. It is trying to be more of an equity proxy. It's not up as much as the S&P 500 but is up a good amount and also managed to mostly trade sideways in 2022 which I wouldn't have expected. The Franklin Systematic Style Premia ETF (FLSP) is very clear up front what its trying to do, "a
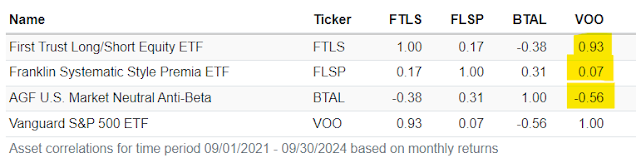
ims to maintain a relatively low correlation to traditional asset classes and to deliver positive returns in rising or falling markets." Being mostly a horizontal line that tilts upward is the right expectation for this one. Comparing it to FTLS isn't the right way to look at it, the comparison would be to other market neutral or absolute return type strategies. We talk about BTAL all the time. It has a negative correlation that I believe it reliable so the result on the chart is right in line with that. It is capable of going up a lot when stocks go down a lot as opposed to FLSP which would hopefully be up a little, no matter what is going on. The correlation matrix captures exactly what I mean.


This list from VettaFi might help with sorting this point out. There are funds on there though that aren't quite long short in the context we're working with but its a good list to research off of. 

I'm not terribly interested in trying to replicate the equity portion of BFAAS. It is heavy foreign and value. The history for value being any kind of timing indicator is lousy. If your portfolio is diversified, then you already have some value and some foreign. The replication is the same for both below except for the equity dislocation (long/short) sleeve, Portfolio 1 with FTLS and Portfolio 2 with BTAL. I didn't run it with FLSP because that one didn't start until late 2021 and the bear market of 2022 skewed all of them very favorably. The longer look creates better context.


The results of either version are valid. The one with BTAL has a lower CAGR and standard deviation which makes sense because of the correlations of FTLS and BTAL. A huge weighting to something with a negative correlation is going to create something of a drag. I am surprised that the Sharpe Ratio for the version with FTLS is lower than VBAIX. 

The paper makes a salient point that I make all the time but might be good to read it from someone else. "Given our valuation-sensitive philosophy, BFAS tends to trail in extended periods of elevated valuations while protecting capital in drawdowns." No portfolio can always be best. Whatever valid portfolio you construct is guaranteed to lag some amount of the time. 

The information, analysis and opinions expressed herein reflect our judgment and opinions as of the date of writing and are subject to change at any time without notice. They are not intended to constitute legal, tax, securities or investment advice or a recommended course of action in any given situation.

Sunday, October 06, 2024

Another Huge Fund You've Probably Never Heard Of

A few days ago we looked at the Pacer Metaurus US Large Cap Dividend Multiplier 400 ETF (QDPL) as being a very big fund that most people probably haven't heard of. The iShares Core Dividend ETF (DIVB) is another $500 million fund that I doubt too many people have heard of. It was mentioned in Barron's. 

Despite the name it is more than just dividends, it is share buybacks combined with dividends. The Cambria Shareholder Yield ETF (SYLD) also combines dividends and buybacks and they use the term shareholder yield to describe that combo. Meb Faber regularly makes the argument that buybacks and dividends are two different versions of the same thing (I am simplifying) except that buybacks are more tax efficient which they are. 

The very basic argument for buybacks, beyond signaling that the company is in a strong financial position is that everything else being equal, fewer shares means less supply which should push the price up. Remember, I said everything else being equal so that assumes constant demand. It gets a little tricky because some companies buyback shares only to then turn around and reissue them via stock option awards to employees. 

In Part 1 of 20 Years Of Blogging, I mentioned that when I was in the CNBC rotation they started asking me to come on for topics I didn't really know too much about. Kind of related, they wanted me to come on one time as the bull on stock buybacks. I know a little but I was not and am not an expert. Yes there is a the potential supply and demand inertia but more than not being an expert, I don't actually believe in it as a factor, I don't think there is any real edge there. Yes, there is research that supports it and if you find it compelling then go for it. 

Looking at SYLD, DIVB which as been around for a while and the Invesco Buyback Achievers ETF (PKW), I don't know how you can push back on the idea that shareholder yield and buybacks are just factors, like any other factor that will at times lead, at times lag and of course cannot always be best.

The Sharpe Ratios of all three are quite a bit less than VOO too.

Year by year, SYLD was the best perform three times including a monster year in 2020, and it was the worst performer twice. DIVB was never the worst or the best but has always been right there with the others. PKW was the best once and the worst once. VOO was the best four times and the worst twice. 

The overall CAGR of all three is lower than VOO but the performance is reasonably in line. The volatility that all three take on is noteworthy. SYLD's is much higher than VOO, that really is a big difference. DIVB's volatility is sort of a push and PKW's is higher but the SYLD number is eyepopping. And all three did go down significantly less than VOO in 2022.

I plugged in the Invesco S&P 500 Momentum ETF (SPMO) to see how it compares. For the same dates, SPMO compounded at 16.85% with a standard deviation of 17.81. So better growth with similar volatility. It was the best performer four times and was never the worst performer. 

The 290 basis points of outperformance over VOO obviously cannot be assured going forward and there will be periods where momentum is the worst factor but for some reasonable chance of outperformance over an intermediate timeframe, how much more volatility would you be willing to take on? Where SPMO offers a reasonable chance of outperformance, there doesn't seem to be the same opportunity with SYLD. I'd expect it to be close more often than not and maybe have another monster year like 2020 but would you be willing to take on that much more volatility without a reasonable chance to outperform? 

I would also consider the correlation matrix. They are all high. SYLD is the lowest but the lack differentiation speaks to the idea that these will mostly tradeoff performance wise over the long term. I've been pointing toward momentum maybe adding some value as part of a blend of factors but going forward but there is no assurance that it can continue to do so. I think it can be close even if it stops outperforming. 


Neither SYLD nor DIVB are big yielders which makes sense. They're higher than VOO at 1.81% and 2.55% respectively. The argument for buybacks, and by extension shareholder yield, as a factor seems overly academic to me. It should work but I think the reality is it is no better than any other factor. If it resonates then go for it. If you can figure out some sort of blend that includes buybacks or shareholder yield with other factors then again, go for it.

The information, analysis and opinions expressed herein reflect our judgment and opinions as of the date of writing and are subject to change at any time without notice. They are not intended to constitute legal, tax, securities or investment advice or a recommended course of action in any given situation.

Saturday, October 05, 2024

Why The Hell Anyone Would Want To Buy That Fund?

We have a couple of different things to look at today starting with a paper from Cliff Asness. The high level idea was to explore whether markets have become less efficient despite how much more quickly information moves. Things like indexing create a headwind to market efficiency, not I am not saying indexing is the equivalent of Marxism like Alliance Bernstein said a few years ago but I think it fair to conclude that the perpetual tidal wave of 401k contributions and other money flowing into the S&P 500 and Russell 1000 has some sort of impact even if it is beyond us to be able to quantify that impact. It's certainly beyond me to quantify the impact, anyway.

Part of the paper talks about factor investing and I think is implying that there is value in rotating between factors. The quote I'm referring to is "for quants, that’s improving your factors and optimization processes." I don't doubt that he is correct but I don't think the typical market participant should think they have any reliable edge on that front. I've mentioned a couple of times that there used to be cyclical indicators that would be quite a bit better than a coin flip for knowing when to favor size, style and some of the others. Some factors were late cycle versus early cycle, there are some yield curve dynamics involved and a couple of more but, if Asness is correct about markets being less efficient then I suspect that however difficult it had been to successfully rotate between factors, it would be more difficult now. Yes value and dividends did better in 2022 but from the standpoint that "risk happens fast," it is difficult to imagine that a lot of investors rotated into those spaces in a timely fashion in late 2021. 

My take on factors has been that if you're interested, pick one or a blend and stick with it realizing it can't always be best. 

The domino effect is that valuations make no sense versus what investors trained in classical value investing learn about markets and investing. For the record, I do not consider myself a value investor, I'm just trying to convey what I think Asness is saying. 

Here is the money quote for me from the paper. "Do not think you can hide from volatility. It either finds you very painfully eventually or you pay too dearly for the fake smoothness along the way." We spend a lot of time here looking at ways to manage volatility and while we look closely at things like covered call funds and multi-asset funds, I continue to circle back to maintaining the majority of the portfolio in plain vanilla equity beta and diversifying with small exposures to uncorrelated and negatively correlated return streams. 

Trying to build a core around something like a covered call fund is an attempt, as Cliff describes it, to hide from volatility. Core, is not remotely close to being a small, satellite type of position. Adding exposure to something with lower volatility and some yield is absolutely valid in my opinion but not as a substitute for meaningful equity exposure. Part of the fun we have here is looking for ways to blend factors to get equity and equity like result with a little less volatility. Maybe something like a covered call fund could be part of the solution but a portfolio needing normal equity exposure to meet it's objective, 40% or 50% or 60% in a fund that hides from volatility is a bad idea. Maybe even down to 25-30% into a fund like this is a bad idea. 

Next, I wanted to revisit the Alpha Architect Tail Risk ETF (CAOS). The chart compares it to Vanguard S&P 500 ETF (VOO), client and personal holding BTAL, the Cambria Tail Risk ETF (TAIL) and the iShares 10-20 Year Treasury ETF (TLH). 


Yahoo Finance 2.0 needs a little work but the blue, almost horizontal line is CAOS. The rest are a little easier to make out. I threw TLH in there because TAIL is a put option overlay on top of a longer dated treasury bond portfolio. With not much action for the puts this year, it makes sense that TAIL looks like TLH for the most part. TLH and TAIL have a 0.53 correlation. You can see the August dip reflected in spikes in TAIL and CAOS but the spike in CAOS is much smaller. CAOS doesn't really have spike in the September dip although it did not go down on those days. 

BTAL has had an odd year. It has pretty much taken the exact opposite path to almost the same result as the S&P 500. The negative correlation is what it should be doing and it's a pleasant surprise that it is up so much this year. 

CAOS looks more like an upward tilting horizontal line alternative than some sort of fund that can have an asymmetric payoff when things in the equity market hit the fan. TAIL and BTAL come much closer to that outcome than CAOS has so far. When we last looked at CAOS, my working theory/expectation was it would mostly look like it has, with the potential to offer tail risk protection. Holding it hasn't hurt anyone but I think I might expect a bigger reaction from it when the market goes down and maybe the next time something serious happens it will go up more than it did in August.

In the current Barron's, Randy Forsyth checks in on closed end funds as short terms rates have started to go down. David Tepper of Tepper Capital Management is cited as liking the Gabelli Dividend & Income Trust (GDV) because it has a 5.4% and trades at 14% discount. Barron's goes on to say that GDV owns "large capitalization blue chips."


The above comparison doesn't look so hot. A lower growth rate in exchange for some yield is fine but that is a lot more volatility to take on for a much lower growth rate. The next thing to check would be how it did in 2022. That decline will be a great litmus test for a long time still, but unfortunately for holders, GDV was worse than the S&P 500 by 42 basis points. It's a closed end fund. Although the article didn't mention, maybe it's a play on the discount to NAV closing? 

The chart is from CEFconnect.com. They have a wealth of information on closed end funds. They used to do the same with ETFs and in what has to be one of the oddest decisions I've ever seen, they bailed on ETFs ages ago. The site is so much better than ETF.com, I guess they didn't want the responsibility of having 10x more traffic than they get for just CEFs. 

Rant over. Looking at the chart, is there any reason to think that now is the time that the discount will get narrower? I mean you could make that guess but there doesn't appear to be even a coin flip's chance. I don't know why the hell anyone would want to buy that fund. There are plenty of sources of yield with nowhere near that kind of volatility. 

Tepper is not the David Tepper who runs Appaloosa and owns the Carolina Panthers. Funny coincidence, Tepper used to call in to the equity desk at Schwab Institutional when I worked there in the 90's. There's no reason for him to remember but it's always fun when I see a name from back then cited somewhere.

The information, analysis and opinions expressed herein reflect our judgment and opinions as of the date of writing and are subject to change at any time without notice. They are not intended to constitute legal, tax, securities or investment advice or a recommended course of action in any given situation.

Friday, October 04, 2024

A Huge ETF You've Probably Never Heard Of

The Pacer Metaurus US Large Cap Dividend Multiplier 400 ETF (QDPL), via a Tweet thread from Corey Hoffstein, is an interesting fund with about $500 million in assets that fits right in with one of the discussions we have here regularly. Metaurus is an investment firm that appears to partner with Pacer on the strategy, there are other Pacer Metaurus funds too. Obviously the name Metaurus was the name of a battle in the second Punic War between Rome and Carthage. Just kidding, I Googled that.

The fund owns the S&P 500 and dividend futures, that's a thing, with the objective of tracking the S&P 500 on a price basis with 4x the index' distribution. We've talked about this some, but pretty superficially with the Overlay Large Cap Shares (OVL). That fund owns the S&P 500 and generates income selling put spreads. Unlike a covered call strategy, selling put spreads does not cap the upside. The negative trade off to what OVL does is that it can go down more than simple market cap weighted (MCW) exposure as was the case in 2022 when it was worse by about 400 basis points. 

A little more specifically, QDPL has 89% in the S&P 500 and the rest dividend futures (cash to collateralize the futures).


I think part of why Corey Tweeted this is it looks like a variation on ReturnStacked ETFs and the graphic is also very similar (I think) to what is in ReturnStacked's marketing material. QDPL though is several years older, having started trading in August, 2021. 

At a high level, being able to track the S&P 500 with a higher yield is interesting and not something that the older covered call funds can do. Some of the newer ones that sell 0dte options instead of monthly expirations seem to do a better job of staying closer. Not close maybe, but closer.


This captures total return of all three funds we're talking about. OVL outperformed in all three of the up years captured and lagged in 2022 like I said. QDPL lagged slightly in all three up years and went down 196 basis points less than VOO in 2022. The total return picture is not discouraging. 

Price-only is a different picture. Part of the price-only lag is that QDPL only has 89% in the actual index. Forgetting everything else for a minute, the expectation should be that it will lag some just because of that fact. That's neither bad nor good, it's an expectation that I think is being set. 

The combo of more yield with less upside is a valid exposure for how it can potentially blend with the other holdings and for the yield that can be added to the overall mix. If the 215 basis point lower standard deviation of QDPL is appealing enough to make the fund the core equity holding then I would suggest reinvesting a good portion of the dividend to not sacrifice too much of MCW's compounded growth. That supposes that the investor needs compounded growth. 

I think there in an interesting way to think about QDPL as sort of a proxy for one aspect of carry. There is a capital efficiency aspect to the fund's payout. Looking at the history of the fund, there hasn't been a problem with the QDPL getting very close to 4x the dividend of the S&P 500. That part of it appears to work.


If a portfolio just held $10,000 in VOO, then in 2023 it would have taken in $162 in dividends. To get that same $162, an investor could have had just 24% of the dollars invested in QDPL to get the same carry. One form of carry is the return, yield or dividends or interest, irrespective of price movement. A stock pays $3/sh in dividends, regardless of whether it goes up 5% or down 5%, the $3 dividend is the carry. 

Lets assume QDPL will continue to get 1/3 of VOO's price appreciation. A 24% weight then to QDPL might contribute 8% of of equity beta to the result. Playing this out hypothetically, the other 92% of equity beta could come from a 46% weighting to a 2x leveraged long fund, leaving room for a variation of return stacking, or creating portable alpha, that avoids multi-asset funds.


The 24/46 blend with the rest in cash was off a bit from exactly tracking VOO because the way it samples out with such a short test, the recovery off the 2022 low was a lot to overcome but it is still close, you can build this for yourself and decide what you think. And it is possible that the new Tradr leveraged long funds will work better in this capacity. I built out the rest of Portfolio 2 with alts we use for blogging purposes all the time. BTAL is a client and personal holding. 

Portfolio 2, has plenty of equity beta, it outperformed VOO slightly and had lower standard deviation but again looked very much like the market. In 2022 out was down 500 basis points less than the S&P 500 though, so that is worth noting. 

On Corey's thread, there was a conversation about how tax inefficient QDPL is because dividends are taxed at ordinary income rates. We don't talk a lot about taxes here but maybe we should talk a little bit more, at least on this one. I'm not a tax expert so I can only tell you how it is, not necessarily why it is. A lot of these options funds characterize the payouts differently than straight dividends.

The vast majority of the payout from QDPL is characterized as a return of capital. In a recent post I mentioned sitting in on a webinar for ProShares S&P 500 High Income ETF (ISPY) which made a big deal out of being able to characterize as return of capital. Simplify Bitcoin Strategy PLUS Income ETF (MAXI)'s "dividend" is almost entirely characterized as return of capital. ISPY and MAXI are both in my ownership universe. There are other funds too that can do this. Return of capital is not taxable when received. It lowers the cost basis so yes, when you sell there will probably be capital gains. For now, long term capital gains tax rates are either 0%, 15% or 20% which will be less than ordinary income rates. Of course, none this matters if the account in question is an IRA, Roth or HSA.

The point of the exercise is to show that for anyone actually interested in portable alpha, I think there is a better way than using some of the more complex multi-asset funds. I think there might be a little more to them than appears, I don't mean that in a good way. Where we talk about investment products evolving, I think there is a path to pulling this off in a manner similar to what we did today, getting what amounts to the full equity effect from just a little less exposure to make room for an alt. While the fund providers in this space talk a lot about wanting to avoid tracking error, I'm not sold on that idea as a priority but if it is your priority, I don't think complex multi-asset funds are the way to get it done. 

The information, analysis and opinions expressed herein reflect our judgment and opinions as of the date of writing and are subject to change at any time without notice. They are not intended to constitute legal, tax, securities or investment advice or a recommended course of action in any given situation.

Thursday, October 03, 2024

Blending Factors

Over the last few days I've fished around looking at multi-asset ETFs that I perceive are intended to be either one fund, portfolio solutions or the major core holding with a little room left for maybe alternatives or thematic exposures or whatever. Often, these funds have a lot going on under the hood and it seems that very few are adequate replacements for the benchmark Vanguard Balanced Index Fund (VBAIX). If an investor wants just one fund that targets 60/40, I do not, most of them simply are not better than VBAIX. There could easily be a role for some of these other funds with a smaller allocation to a more involved portfolio though.

In working through some of these, I circled back to the Leuthold Core ETF (LCF) which I wrote about in more detail in July. By my count it has not quite 60% in equities, 21.5% in fixed income including the iShares 1-3 Treasury ETF (SHY), 9.9% in cash, almost 6.5% in inverse equity funds and then a little bit in euro and yen ETFs. When we looked at in July it had a little Bitcoin. The asset allocation numbers are similar to what they were when we looked three months ago so comparing it VBAIX makes some sense.


Since inception, LCR has compounded at 8.52% with a standard deviation of 10.16 compared to 8.62% growth and 13.10 standard dev for VBAIX. LCR has lagged every year but been close to VBAIX except for 2022 obviously when it outperformed by 930 basis points. If we go the rest of the decade without a meaningful decline, which seems unlikely, then LCR would probably continue to lag but be close most of the time. Lag most of the time but close with real defensive properties is very good outcome for a fund.

I wanted to try to figure out how to work LCR into a robust backtest and think I figured something out. A ratio of 65% Invesco S&P 500 Momentum (SPMO) and 35% LCR just about equaled the return of the S&P 500, the blend was better by 26 basis points, but with a standard deviation that was lower by 277 basis points which I think is a noteworthy difference. 


Portfolio 3 simply takes that last 20% and splits it between TFLO and SHRIX and the benchmark is VBAIX. BTAL is a client and personal holding. 


The three generally outperform by 300-400 basis points and the standard deviations are quite a bit lower. The long term results, as long as they can be for LCR's age, are of course compelling but as you can see below, anyone holding this portfolio needs to be prepared to lag at times. 


If someone had put some version of this portfolio on as soon as LCR listed in early 2020, they'd have been behind by a lot by the end of year and it would have been easy to throw in the towel. With some time under its belt, I think we have some expectation of LCR as I said above. Jumping right in, there probably would have been no reasonable expectation of what LCR would do. If you actually put 17.5% into one fund, you probably should have some sort of expectation for what it will do, in this case I think that is lag some but be close and then offer some defense during a decline. You already have some idea of what a broad based index fund that isn't the S&P 500 will do....sometimes it will be ahead and sometimes it will lag. In ten full and partial years, SPMO has lagged the S&P 4 times and outperformed 6 on the way to CAGR that was better by 232 basis points. In a different ten year window, maybe SPMO would lag a little but it will very likely be close. 

The information, analysis and opinions expressed herein reflect our judgment and opinions as of the date of writing and are subject to change at any time without notice. They are not intended to constitute legal, tax, securities or investment advice or a recommended course of action in any given situation.

Wednesday, October 02, 2024

20 Years Of Blogging! Part 2

Part 1 took a look the evolution of the blog and for Part 2, I want to try to look at how portfolio process has evolved and track how I view life milestones as related to things like retirement. 

Starting with portfolio construction, we've always placed a emphasis on holding long term. The chart captures most, not all, of the names that I've held for clients since I started doing this at my old firm. It shows three stocks that have outperformed the S&P 500 and three that have underperformed.


The names aren't important for this post. The three underperformers are all names from defensive sectors with higher dividends. The chart is price only and the yields ranged from mostly around 3%, up to 4% occasionally (one has been closer to 4% than 3% pretty consistently). The total return lag isn't as big as it appears on the chart but they clearly lagged. The outperformers are growthier, with two out of the three coming from sectors you'd expect to see more growth and so larger declines potentially too. 

You see charts like this as a younger investor and maybe it makes less of an impression as opposed to having lived through it first hand. It has given me greater respect for the concept of ergodicity, the natural inertia for markets to go up far more often than not. Two of the three laggards went down far less in 2008 as did one of the outperformers. The third laggard was down a little worse than the S&P 500.

Here's the same batch just for 2022.


If they all go up together, then they will probably all go down together. I don't remember where I got that one but both charts show the importance of owning stocks or ETFs with different attributes that react differently to different types of market environments. If you are going to go narrower than broad based index funds, then I think it is important to have some holdings that at a minimum can be reasonably counted on to go down less. For my money, I would want to expand that to having some holdings that can be reasonably be counted on to go up when stocks go down. Obviously, if it can be reasonably expected to go up in a down market then is will probably go down in an up market. 

This has also reiterated how important patience is in investing. There's another batch of names in the portfolio that have been maybe been in there 12-14 years. Same thing, some big outperformers and some laggards but again they bring different attributes to the portfolio. 

The evolution of alternative strategies and my willingness to explore them has helped the portfolio too. They don't all work out as hoped but I believe they have helped considerably in smoothing out the ride. The ramp up process to using alternatives is also an exercise in patience. The other day I mentioned that original blog site is gone but that I can see the posts in the blogger template. On Christmas Day, 2005 I wrote about alternatives including a look at the Merger Fund (MERFX). I didn't add that fund in until two years later. Sometimes I just know it will work like BLNDX and BTAL, but plenty of times it takes a while for me to draw a conclusion one way or another. Where I am using more alts these days in place of traditional fixed income, I don't think the process has sped up any. 

I believe I place greater emphasis on smoothing out the ride. This is for two reasons. One is to spare or at least minimize putting clients through the emotional ringer like during the soon to be forgotten Great Hiccup of August 2024. Every time I tell a client "I don't know what the market will do but this decline will not impact your income needs," I can hear the relief in their voice. There is also the reality that all advisors have clients who take way more out than is safe. One client has been taking out 10-15% for 18 years. Smoothing out the ride lessens the damage from that sort of behavior. I don't know if he will ever deplete this account or not but he's very lucky to have made it so long without doing so. 

Another small change in portfolio management is that I've been willing to have zero exposure to the energy sector. Zero exposure to a sector is a big bet I used to say.


The simple observation is that the energy sector is broken. The volatility for a sector is off the chart but there has been no terrific growth to compensate for that volatility. From the top down, any argument for investing in oil is weak. At some point I'm sure it will heal but I have no idea when and so it just makes sense to avoid for now. 

On a personal level, not much has changed. Things have evolved but not really changed. At 38, I figured I would do the same work forever without much interest in retiring. From the standpoint of never knowing what the future you will want to do, I didn't wake up one day at 50 and say "oh man, I gotta make a change" which is something that happens to plenty of people, maybe not 50 exactly but you get the idea. 

In terms of lifestyle ideas that I've shared, I've tried to walk the walk on that. I've kept myself physically fit, invested time into creating income streams in the future if needed, stayed curious and we continue to live below our means. All of these things make life much easier. 

The biggest addition to my life might be that I've become much more of a health nut. I've always lifted weights and hiked but beyond saying "don't drink soda," my understanding of the role diet plays in successful aging was woefully lacking and so I've spent a lot of time trying to learn more. I'm far more involved with the fire department than I used to be. I went to training and responded to calls but being chief is obviously a significant leveling up of engagement. 

I've never been much of a goal setter in terms of thinking about the next 20 years but my priorities of being healthy, happy at home, owning my time and not having financial stress (this does not require being rich) are still front and center for me. My belief in very actively volunteering has not waivered, if anything, I believe that even more than I did. 

So much has happened in markets in the last 20 years, I'm not sure if hoping the next 20 are just as interesting is a good thing or a bad thing but I hope to be blogging about it all the way through. 

The information, analysis and opinions expressed herein reflect our judgment and opinions as of the date of writing and are subject to change at any time without notice. They are not intended to constitute legal, tax, securities or investment advice or a recommended course of action in any given situation.

Time To Get Yieldy?

The other day I mentioned starting to think about how to gameplan having a lost decade for stocks. That's not an attempt to predict anyt...