Friday, March 21, 2025

Sizing Up Multi-Strategy

One of the pre-market Bloomberg emails gave a positive mention to the Cambria Global Asset Allocation ETF (GAA) because it is up in what of course has been a tough tape for equities this year. We've looked at GAA once or twice. It is an interesting asset allocation that targets 40% in equities, 40% in fixed income and 20% in alternatives. I think the strategy borrows a little from all-weather and Permanent Portfolio....a little. 

A fund like GAA seems like it could be looked to as a single fund portfolio. I put the following together to try to put the single fund portfolio idea into context. 


GAA is not a proxy for equity exposure, I don't think Bloomberg is implying that so much as pointing out that it is holding up well so far this year. Comparing GAA to VBAIX and PRPFX makes sense, all three are multi-asset even if the weightings and exposures are a little different. 

The growth rate for GAA is noticeably lower than VBAIX and PRPFX and somewhat lower than Portfolio 5 which could be thought of as a simpler, build-it-yourself version of GAA. The lower growth rate isn't automatically bad but I do think the compensation for a lower growth rate should be lower volatility and holding up better during various types of declines. The drawdown results for GAA are a mixed bag meaning it has not been reliably better, just better sometimes. Portfolio 5 does give up CAGR versus VBAIX and PRPFX but the volatility is a good bit lower than the others and the drawdowns have been considerably lower than the others.

Portfolio 5 includes AGG which of course I want no part of. I think the reason why several of the Cambria funds, including GAA, have high volatility numbers is the firm's willingness to hold longer duration fixed income than what we play around with here and what I do in clients accounts IRL. 

If we swap out AGG and replace it with TFLO which is a floating rate ETF, the CAGR goes up by 14 basis points and volatility drops by 27 basis points which are not dramatic numbers but helped meaningfully in 2022, leading to a performance improvement of 601 basis points. 

The information, analysis and opinions expressed herein reflect our judgment and opinions as of the date of writing and are subject to change at any time without notice. They are not intended to constitute legal, tax, securities or investment advice or a recommended course of action in any given situation. 

Thursday, March 20, 2025

The Power Of Thematic Investing

Tuttle Capital put out a report that covered a lot of ground. There are two things I wanted to focus on from the report. First was his dour conclusion about 60/40 going forward, he calls 60/40 a lie, using AI. Bonds are the problem says his AI queries. There are problems with correlation which we cover all the time as well as now price inflation which sets the stage for higher interest rates. My focus has not been to try to predict what interest rates will do but to point out (many years ago) that rates at all time lows and going lower take on enormous risk and now today pointing out the longer dated bonds and bond funds have equity like volatility and the correlation of bonds to stocks has become unreliable. 

A more interesting observation he makes is that "the simplistic, passive nature of the 60/40 approach inherently lacks strategic adaptability. It doesn't adjust dynamically to volatility or exploit market anomalies effectively." There is certainly something to that but it implies a dichotomy of passive 60/40 or something very actively managed without other paths. I don't think Tuttle actually believes that there are only two ways to go but I do take that from the passage. 

On these AI queries they run, they ask it to assign a ranking out of ten so 8, 9 or 10 out of 10 is good and lower numbers are not good. ChatGPT 4.5 gave plain vanilla 60/40 a 2/10 going forward. There other reasons cited that you can see in the report. The odds are pretty good that plain vanilla 60/40 will still get the job done over longer periods but I would caution that the ride has been much bumpier since late 2021 and will stay that way for a while. 

Adaptability is a great word for portfolio construction and ongoing management. I don't believe adaptability has to mean very actively trading a portfolio but there will be occasional trades that need to be made. In terms of across the board trades in the last few months that fit this discussion of adaptability, I sold one stock that I believe is vulnerable to tariffs, I added an inverse fund around the election and I bought a gold ETF a few weeks ago. The trades were an attempt to adapt to changes in the macro environment. None of them were hideously wrong out of the blocks but it's too soon to declare victory with them. 

The Tuttle report also included a model portfolio based on their HEAT ideology which is an acronym for hedges, edges, asymmetry and themes. The asset allocation was 10% to hedges, 30% to T-bills for asymmetry but that seems more like optionality to me, 9% to edges which included one broad stock picking ETF, a derivative income fund and a short volatility product. The other 51% was spread across about 20 thematic ETFs including countries, tech related niches and crypto. It's probably not ok to list out the ETFs he used but you can see for yourself of course but I want to try to replicate the asset class exposures. 


CASHX is the T-bill/asymmetry/optionality exposure, PUTW, CWS and client/personal holding PPFIX are the edges sleeve while client/personal holdings BTAL and CBOE are the hedges. For the themes, I just chose the seven stocks and ETFs from the basic client portfolio, weighting five of them at 7% each and two of them at 8%.


And the drawdown chart.


The results are surprising to me. Although it has a better growth rate, my version of HEAT has lagged in five out of nine full and partial years. There might be a selection issue if you grant me that BTAL and CBOE are effective tools for defense. 

Random Roger HEAT being less volatile makes sense given the cash position and the 10% split between BTAL and CBOE. There is for sure 62% in equities between the themes, edges and CBOE. I would not include BTAL as being equity beta and PPFIX while a bullish strategy has almost no equity beta. 

Picking themes can be tricky. My version of HEAT doesn't cherry pick themes from the portfolio, it's all of the holdings that I think are themes. For example, JNJ is not one I consider a theme but NVO is. NVO has been a great hold for most the the period studied but of course the price has struggled for a while now. Putting half of a portfolio into themes is a big bet versus a little more into broad holdings, combined with themes as being less risky. 

The information, analysis and opinions expressed herein reflect our judgment and opinions as of the date of writing and are subject to change at any time without notice. They are not intended to constitute legal, tax, securities or investment advice or a recommended course of action in any given situation. 

Tuesday, March 18, 2025

"Bear Market Cumulative Returns"

Bill Hester from Hussman Funds had a lengthy write up on diversifiers that track what he called Bear Market Cumulative Returns (BMCR). This wasn't a discussion about alternative strategies but there were a couple of fantastic charts.


This is helpful for creating some understanding of tendencies of factors. One very interesting tidbit from the table is that small caps are all over the place. The factors that drift up toward the top of table seem fairly consistent which is useful information. A portfolio that goes narrower than an S&P 500 500 or total market fund probably has some exposure to low vol, dividends and the others. Yes the broad based funds do too but you don't feel the effect that way. Yahoo shows the S&P 500 down 6% YTD (not sure that is right but that's ok) while the Schwab US Dividend Equity Fund (SCHD) is up 1.7% for example. 

We talk about this at the sector level too. Some sectors tend to go up more on the way up and so they tend to go down more on the way down. Something like staples usually goes up less and down less. YTD, the Staples Sector SPDR (XLP) is up 1.6% per Yahoo while the Tech Sector SPDR (XLK) is down 10.6%.

How reliable do you think these various exposures are? I think they're reasonably reliable but every now and then, they won't "work," kind how managed futures has struggled through most of the current event. We have written about managed futures I don't know how many times, saying repeatedly not go heavy in case they somehow don't "work" during some random market event and that's what has happened so far on this go around. That might start to change as we mentioned the other day if the current downtrend in equities continues. 

Now for a little more fun. First this Tweet from Eric Balchunas;

The initial read from ETF Twitter was that ANIM would own five 2x single stock ETFs and that WILD would leverage up from there essentially being a 4x fund. Later on, the crowd drifted toward ANIM owning the five underlying stocks, not 2x funds of those stocks but that WILD would own the 2x ETFs making it a slightly more diversified 2x fund than just a single stock 2x fund.

These are a lot of fun to look at and play around with conceptually but getting caught on the wrong side of one of these would be painful.

And checking in on the GraniteShares YieldBoost SPY ETF (YSPY) that sells put spreads on a levered S&P 500 ETF;


Yes, that is a rough start, clearly, but interestingly the math checks out. YSPY sells put spreads on a 3x fund. Oddly, the fund page no longer mentioned targeting a 2x outcome, it appears to now say 3x. When I spoke to them they implied it was some sort of delta/gamma effect where what they were doing would yield a result that looked like 2x. Well, I'm not sure what to make of that but it is still interesting to see whether this will turn out to be a great fund or a catastrophe. A little bigger picture, selling volatility is a valid strategy but might be tricky to do in a fund. 

Lastly, from an old blog post by Bob Elliott of Unlimited Funds that runs the HFND ETF, he looked at an allocation of 75% "diversified alpha" and 25% managed futures as a diversifying strategy. I took what he was saying to be expressed as follows in a portfolio.

And compared to just VBAIX in Portfolio 2


The longer term result is interesting. Portfolio 1 lagged by quite a bit in 2019 and then even more in 2020. Then it made it back in 2022 when it was only down 1.1%. With a little more effort, this could probably be molded into something with a more robust outcome than the MBXIX/AQMIX/VBAIX we used for a first look.

The information, analysis and opinions expressed herein reflect our judgment and opinions as of the date of writing and are subject to change at any time without notice. They are not intended to constitute legal, tax, securities or investment advice or a recommended course of action in any given situation. 

Monday, March 17, 2025

Always Read The Comments

Bill Bengen who is credited with coming up with the 4% Rule for retirement withdrawal rates sat for an interview with Yahoo. There's not much new since I last wrote about Bengen which was a bit of a bombshell. Not 4% but 4.7%. 

So this post is about some of the comments. 

If you can swing it and can do the work or get the work done, yes. We've been insanely lucky with our short term rental but arguably you only need to not be unlucky with something like this. It does take a lot of work though, don't sell that part of it short. 


"Raiding" his IRA, this guy is either very right or very wrong. 

Dude, no. 


Only one way? And that way is with annuities? Buy annuities, don't buy them, whatever, but only one way comments are nonsensical. 


Some good thoughts here regardless of whether the numbers are similar to yours or not. 


At a 3% rate of price inflation, in 15 years expenses will be 50% higher. 


Get a grip my guy, at this point it is a single digit decline. If he is 70 and makes it passed 90, he will see several more declines far worse than the current one. All he needs to do is not panic.

The information, analysis and opinions expressed herein reflect our judgment and opinions as of the date of writing and are subject to change at any time without notice. They are not intended to constitute legal, tax, securities or investment advice or a recommended course of action in any given situation. 

Sunday, March 16, 2025

Sunday Night CAOS

Certain things fascinate me including whether a tail risk ETF will ever solve the dilemma of bleeding away as put options expire worthless and the fund then buys more. Going long the VIX is another way to put on the exposure in theory but is very difficult to execute on with the failed Simplify Tail Risk ETF (CYA) as an example. 

In a recent post we looked at the filed for Tuttle Capital No Bleed Tail Risk ETF(OHNO) which will have several different strategies under the hood if it lists. I have no idea if OHNO will work the way prospective holder would hope for but I am intrigued.

We've also looked the Alpha Architect Tail Risk ETF (CAOS) which is a tough one to figure out. YTD has been a good test for a lot of things.


CAOS is the flat blue line, the S&P 500 in pink and the Cambria Tail Risk ETF (TAIL) is the green line. YTD, in a rough market, TAIL is probably doing what holders would hope for. Part of the tail wind is the lift from longer dated treasuries which are up a little this year. In 2022 the long term treasury exposure was a serious drag. Despite the drop in markets, TAIL was down 13% that year because longer bonds got hit very hard.

CAOS has been pretty reliable as a horizontal line with a slight upward tilt but I would not describe the return as being meaningfully sensitive to the decline in the broad market. It did react to the dip last August but not this one. In one post about CAOS, months ago, I suggested it could be a horizontal line that might offer some protection and maybe that's how it is turning out. 

The information, analysis and opinions expressed herein reflect our judgment and opinions as of the date of writing and are subject to change at any time without notice. They are not intended to constitute legal, tax, securities or investment advice or a recommended course of action in any given situation.

Saturday, March 15, 2025

Simplifying Portfolio Hedging

For today's post, I want to take on what I think are a couple of commonly held beliefs about investing. 

The first one is whether or not we need to worry about outperforming the market from year to year. Do we even need to try? I know plenty of advisors and do-it-yourselfers do focus on this but I would tell you it doesn't matter. To clarify, this thought excludes certain pools of capital like hedge funds and stock picking mutual funds. 

How many years have you been a market participant? Assuming you are not brand new, without looking, how many years have you outperformed the market and how many have you lagged? Odds are you don't know. Without looking, I don't know. I know I've outperformed in the few years that it mattered (large declines) which does not imply any guarantees about future results. An investor with ordinary skill, not gifted not woefully incompetent, will have years where they are ahead and years they lag, there's no avoiding that. 

What matters is having enough when you need it. You're 81 and been taking income from your portfolio for 15 years, what matters to you more, that you can continue to take what you need from your portfolio or that four year run in your mid-50's when you beat (or lagged) the market? If you're 81 and can no longer meet your income need from your portfolio, that is what matters. The example assumes no sort of serious medical or family calamity that altered your financial plan, life happens that way sometimes. 

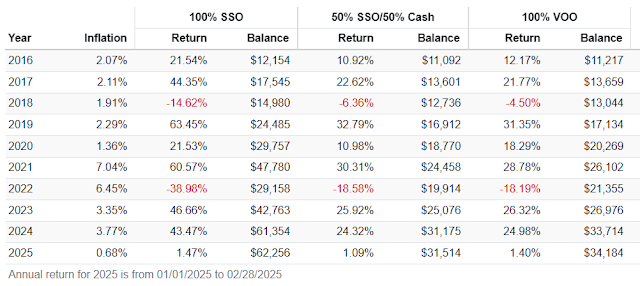
Here's a portfolio I pulled out of nowhere versus the Vanguard Balanced Index Fund (VBAIX) for a decently long period of time. 


Looked at over the course of almost eight years, who wouldn't want that result? Market equaling with far less volatility. It's statistically superior by almost every metric. Here's the thing, it lags almost every year. Someone sitting in this would lag year after year. There were a couple of instances of outperformance in the period studied including 2022 when it was up 46 basis points and it is slightly ahead this year too. The convergence of the growth rates is probably just a coincidence. Over the next ten years, if markets are up eight times, I would expect it would lag those eight times.

I'd be happy with that standard dev number and lagging by 100 bps annually. The important thing is having enough when you need it and one way to improve the odds of having enough is by avoiding behavioral errors that permanently impair capital and one way to avoid those behavioral errors is to smooth out the ride in such a way that the portfolio goes down less fairly reliably (no absolutes). 

There are quite a few different types of participants for whom this does not apply as I mentioned above and certainly personality types for whom this would not fit but reliably going down less while getting decent, not even great, upside participation prevents a lot of problems. 

The other one isn't necessarily a common held belief, more like deconstructing the thought process to a Barron's article that looks at how to hedge against a crash. It was essentially a list of possible ways to hedge that highlighted the negatives of those ways before concluding that bonds are the best tool. Forgetting all the work we do here with countless ways to offset market volatility with alternatives, the article didn't mention gold or commodities. I mean....

Holding on to 100% of something like VBAIX all the way through market cycle after market cycle is absolutely valid other than addressing sequence of return risk when you get within a few of retirement. But for anyone not wanting to ride that roller coaster all the way down in that part of the of the cycle, I would say to think of hedging in very simple terms. What tools can you use, so using tools implies adding something not selling VBAIX, to reduce volatility? The article points out the various drawbacks of using inverse funds, yes the article is right but when the stock market drops today, what will an inverse fund do? It will go up. When a the stock market goes down this week, what will an inverse fund do? It will go up. For a month? Ok, it starts getting a little less reliable at this point but in a truly rough month for the stock market, it is very very likely that an inverse fund will go up.

SH is a client holding that I added pretty close to election day. It's been rough over the last month and SH is up. It's not up the exact amount that the S&P 500 is down but do you think it's close? Regardless of whether you think it is close, it was a rough month for stocks and SH was up. The 2x version of SH has symbol SDS and for the last month, Yahoo has it up 17.39%. Is that close? It's not exact but is it close? Again, either way, a rough month for stocks and SDS was up. I'd argue they are reliable in this regard but not down to the basis point. While I am confident in these, don't use them if you are not, I keep the allocation to SH very small for that instance when it somehow goes down in a rough month for equities. All the risks noted, the odds that a small allocation will reduce net long exposure are very high. I would also note that I am nowhere near as confident in inverse funds tracking narrower indexes or individual stocks, I've only ever used SH or SDS.

For the previous month, Yahoo has the SPDR Gold Trust (GLD) up 3.5%. For the previous month the iShares commodity ETF with symbol COMT was down 2.5% so ok, hasn't been working on this go around but when the S&P 500 was bottoming out in the fall of 2022 with a 21% drop, COMT was up 21%. Maybe you want commodity exposure or maybe you don't but there's something to it as a hedge. 

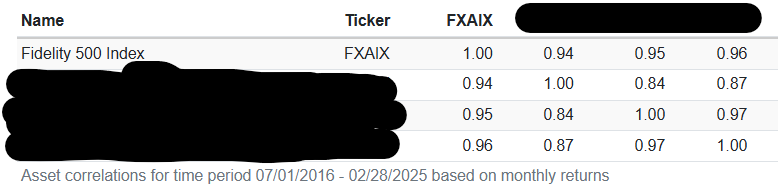
Long time readers might know about my use of BTAL for clients (personal holding too) in this regard. A long short fund that we've looked at once or twice might also be useful too but I'm not sure is charted below. 


Invenomic Institutional (BIVIX), for retail investors the symbol is BIVRX, has plenty of history of differentiating from the the S&P 500 but in 2021 it was up a ton when the S&P 500 was also up a lot. BIVIX is actively managed and the fact sheet uses the word quantitative not systematic so maybe there will be times where it does correlate and times when it doesn't. Where there is BTAL that I would say is very reliable, BIVIX that might be reliable, there must be others that we don't know about that could function in this hedging role. 

For anyone interested in doing the work, maybe Barron's wasn't, there are ways to reduce net long exposure with hedges without having to sell in case equities did not go down. As things get worse, the hedge will grow to protect more of the portfolio and if things get better, the hedge will shrink, acting as less of a drag on overall returns. 

The concepts here are very simple to understand which makes it easy to sift through whether this is or is not something you want to do and then go learn from there if interested.

The information, analysis and opinions expressed herein reflect our judgment and opinions as of the date of writing and are subject to change at any time without notice. They are not intended to constitute legal, tax, securities or investment advice or a recommended course of action in any given situation.

Friday, March 14, 2025

Drinking From A Flamethrower

First up is the new Rex Bitcoin Corporate Treasury Convertible Bond ETF (BMAX). It owns convertible bonds of companies who issue the converts to buy Bitcoin. When I read about this, my computer melted. For now, there are very few bond holdings from only three issuers, Microstrategy (maybe its just called Strategy now, not sure where that name change stands), Mara Holdings and Riot Platforms. 

Dave Nadig found a potential tax problem in the fine print. Apparently it is not diversified enough to meet RIC, regulated investment company, standards which as Dave tells it would nullify the tax benefits associated with ETFs. I'm not sure if there is a process that would resolve this issue if/when it becomes more diversified. 

That being said I am of course fascinated by this. Michael Saylor (CEO of Strategy) acolytes think he's a genius who has found a way to print money via Bitcoin yield which is a term he made up while skeptics think it is all complete bullshit. Most of the converts from Strategy are zero coupon and the way it works out, it is either paying more for Bitcoin than it is worth or it is a way to lever up your Bitcoin exposure. Here's another explainer from Benzinga via Fidelity


Convertible bonds have a lot of equity beta as the chart shows. I threw in convertible arbitrage to show how different they are. I don't have a Bloomberg to chart out the Strategy converts but a Google search says they are relatively volatile compared to most of the convertible space. That sets the stage for BMAX to be like drinking from a flamethrower but either way, fascinating. 

Bloomberg reported that the current 10% drop for the broad market was the 7th fastest correction on record, taking only 16 trading days. The nature of fast declines is that they tend to snap back quickly but there is obviously no way to know whether this one will or not. The huge lift on Friday isn't indicative of this being over just yet. The tape would be a little more constructive if the declines stopped with more of a whimper, just petering out versus such a dramatic move up. The best example of this that I can think of to make the point was in the fall of 2008 when one day, the Dow fell 1000 points and then the next day it made it most of it back. Of course the bottom was still months away. 

A reader question served as a good prompt for not a quadrant portfolio but for a couple of different three fund portfolio ideas that might be off the beaten path a little bit.


SPMO is the Invesco S&P 500 Momentum ETF. Both portfolios have higher returns and lower standard deviations than PRPFX and VBAIX. In 2022 Portfolio 1 fell 6.27% versus a decline of 5.29% for PRPFX and 16.87% for VBAIX. Portfolio 2, the one with managed futures, was up 2.77%. It's managed futures so of course it backtests very well but there is misery in actually holding it, especially 25%. It's useful for modeling but too much for me in real life. Same with catastrophe bonds. The right type of storm comes along in such a way that catches fund managers offsides and that could be painful.

The information, analysis and opinions expressed herein reflect our judgment and opinions as of the date of writing and are subject to change at any time without notice. They are not intended to constitute legal, tax, securities or investment advice or a recommended course of action in any given situation.

Thursday, March 13, 2025

Did Managed Futures Just Go Short Equities?

Barron's picked up on a point we've been making here for I don't know how long about CBOE Holdings (CBOE) having defensive qualities. CBOE is a client and personal holding. They talked about options trading increasing during times of turmoil, yes it does, but oddly it never mentioned the VIX Index or the word volatility. Other exchanges trade options too but my thesis has been that CBOE has this defensive attribute because the VIX option complex trades there. 

I believe it is quite reliable in this regard but not infallible. In one of the down days this week, it was also down. It was up 3% today but if you go look at it now on Yahoo, there are some weird after hours prints. There were a couple of prints about $10 below the close and at least one $7 above the closing print. 

Here's a blog post reviewing research that concludes leveraged ETFs don't lag over longer holding periods anywhere near as much as typically believed. Part of the equation is that the cost of leverage has to be embedded in the pricing of the levered funds. 

The personal observation that I am most comfortable with is that 2x long S&P 500 hasn't deviated that badly when looked at year by year.

You can decide for yourself whether it's close enough or not. And 2020 is a great example of what can go wrong, the Pandemic Crash was too big of a hole for it to dig out of. The narrower or more volatile the underlying is, the less likely this observation is to stand up. We've had some fun exploring 2x levered single stock ETFs for capital efficiency but in real life, it's not something I would do. I may be proven wrong but I think the QuantifyFunds 100/100 suite where each fund is 100% in two different stocks have a chance to be useful holds for barbelling volatility and basis points into a portfolio which if correct, would be great for managing sequence of return risk. To be clear, they've only been trading for a week or two which is nowhere near enough time to draw a conclusion. 

The ReturnStacked guys put out a short paper on the right way to use leverage and the wrong way to use it. The TLDR for me about the wrong way are the countless examples in history of misusing leverage which they point out. They cite that if a hedge fund uses 5 to 1 leverage to buy volatile stocks and then they get caught in a 20% decline for those stocks, the fund is wiped out. The example they use as the right way to use it is leveraging up by 50% to add an uncorrelated strategy like managed futures (or other alternative). 

I'm not a fan of leverage but who cares what I think, can it be used in the manner that the paper describes?


There are no hideous declines in the backtest where the levered portfolios go down far, far worse than straight VBAIX. The portfolio that leverages up to take in multi strategy was obviously the best performer but the trade off was dropping more than the others in late 2018 and then again in 2020 Pandemic Crash. These larger drawdowns were not ruinously worse but noticeably so. You can decide for yourself whether the modest uptick in volatility is worth the modest outperformance. 

I threw in 60% SPY/40% Merger Arb for an unlevered comparison. The volatility number for that portfolio versus VBAIX doesn't seem right to me and FWIW, Portfoliovisualizer has 60% SPY/40% Merger Arb with  a standard deviation 89 basis points lower than VBAIX and outperforming by 134 basis points annually. 

My concern then must be of something that hasn't happened as opposed to repeat of something that has happened. I saw a post saying that managed futures programs have now gone short equities. So if that is correct and this event continues to send equities lower then managed futures should do better than they've been doing, most of the funds I follow were up today, none were down. We'll see if that plays out but it would also have favorable implications for Portfolio 1 in our backtest that leverages up to put 50% into managed futures. 

Ok, so back to worrying about something that has never happened. Fair enough that I might be wrong about this but if you are an advisor, do you want to have to explain a type of blow up that has never happened to your clients? The extra 55 basis points (between Portfolio 1 with managed futures and VBAIX) would not be worth the risk to me. 

We've talked plenty about different ways to embed capital efficiency in smaller doses. The way I use client/personal holding BTAL, it it went down in lockstep with the index in a long and slow decline, the actual impact could be noticeable, but even then maybe not, but nowhere close to ruinous. 

The information, analysis and opinions expressed herein reflect our judgment and opinions as of the date of writing and are subject to change at any time without notice. They are not intended to constitute legal, tax, securities or investment advice or a recommended course of action in any given situation.

Wednesday, March 12, 2025

Four Quadrant Portfolio Check Up

Let's dig in some more on Permanent Portfolio quadrant style. We took a shorter look on February 25 but with the market's deterioration since, it's a good time to revisit as well as continue this week's theme of learning from the current stress test. 

Below compares the Cambria Trinity ETF (TRTY) which is quadrant-ish and does some interesting things allocation-wise. AQR Multi-Asset (AQRIX) used to be called Risk Parity and it also does some quadranty stuff. PRPFX is the inspiration for all of these so of course we're including that one. Next is the allocation for the United States Sovereign Wealth Fund ETF that I made up a few days ago and next to that is my most recent attempt from November to recreate the Cockroach Portfolio which is managed by Mutiny Funds.


First the longer term result as far back as it can go.


For the same period, the Vanguard Balanced Index Fund (VBAIX) had a growth rate of 8.37% and volatility was 10.87%. The max drawdowns of the backtested portfolios bottomed out in late 2022 as follows


To the extent quadrant style might intersect with all-weather, you can decide for yourself whether any of them were all weather enough. There's no wrong conclusion to draw, do you think they are all-weather enough? AQRIX obviously was hit the hardest in 2022 which makes sense from the standpoint of it being a risk parity strategy but the Risk Parity ETF (RPAR) was down 29% at that same point. RPAR is indexed and I think that fund's result shows that risk parity doesn't lend itself to an indexed approach. 

TRTY is a tough hold. It's growth rate since inception is 3.58% going back to September, 2018 but a lot of that comes from a 15% lift in 2021 (numbers per testfol.io). If the volatility was very low then the tradeoff might be more attractive. It had a big drawdown in the 2020 Pandemic Crash which, ok, something like that sure but it had a surprisingly big drawdown in 2022 as you can see at 13%.

PRPFX has a higher growth rate with less volatility than VBAIX over a very long time horizon. That is very likely, the quadrant style on full display, with gold and cash proxies allowing it to have much smaller drawdowns in most, not all, adverse market events. 

The United States Sovereign Wealth Fund ETF that I made up is primarily designed to be counter cyclical, that is to have very little equity beta and a low standard deviation which it does. If I actually made this an ETF (I'm open to the idea if anyone from a white label is reading this), it would be a diversifier, maybe in the realm of absolute return although the CAGR and standard deviation might be a little higher than most funds in that category. I would say, that if the United States Sovereign Wealth Fund ETF that I made up is best performer in a portfolio, then maybe things in the world aren't going so well. 

And finally, the Cockroach Portfolio replication. That is a very specialized type of result. I think it is important to be willing to have your portfolio really differentiate at times and this one seems to differentiate all the time. I took out TRTY and AQRIX and added VOO and VBAIX to show how differentiated Cockroach, or at least my attempt to replicate it, has been.


The lower growth rate with lower volatility can absolutely be appropriate for some investors. If someone is legitimately ahead of the game or maybe has income streams beyond their portfolio and Social Security then a CPIplus sort of return, which might be a good way to think about the Cockroach replication, is valid. 

Back to the top and what we are learning, if anything, from the current stress test.

  • VOO down 4.32% YTD through yesterday
  • VBAIX down 1.92% YTD
  • TRTY down 5 basis points
  • AQRIX up 2.01%
  • United States Sovereign Wealth Fund ETF that I made up +2.31%
  • Cockroach Replication up 4.34%.

I'm obviously going to conclude that alternatives in suitably small doses and some degree of differentiation are crucial for longer term investing success. Differentiation is good when you want it, challenging when you don't.

The information, analysis and opinions expressed herein reflect our judgment and opinions as of the date of writing and are subject to change at any time without notice. They are not intended to constitute legal, tax, securities or investment advice or a recommended course of action in any given situation.

Tuesday, March 11, 2025

Did Capital Efficiency Malfunction In This Decline?

A chart similar to this one of the some of the private equity operators has been making the rounds. 


This is interesting for a few reasons. In a blogging context we look at these stocks occasionally for barbelling returns and because they are beneficiaries of private equity fees, not proxies for investing in PE. If you look at long term charts of these stocks they have been moon shots so the tradeoff to stocks that can wildly outperform is that they can catch the Ebola virus when the market gets the sniffles. Another dynamic that might be weighing the stocks down is the possible ending of the carried interest tax break. How great have the returns been for the Mag 7 stocks for the last couple of years, but so far in 2025 most of them look like they are down mid-teens to mid-20's percent. 

So following up on yesterday's post about trying to learn some things about all the portfolio theory we explore here, let's put the barbell and capital efficient portfolio structures as we've experimented with them through a real world test. The concept of barbell strategies, which are a form of capital efficiency, in this context is sort of borrowed from Nassim Taleb who years ago talked about putting 10% of a portfolio in very risky stuff and the other 90% in very safe things like T-bills. My first introduction to the concept was from my time at Fisher Investments in 2002. I've told this 100 times but two of the smarter guys there talked about how a 2% short position in Nikkei Futures, 98% in cash, equaled the return of the S&P 500. I can't vouch for that being accurate but it crystalizes the concept. 

The first three portfolios are various forms of capital efficiency in that they use leverage as follows. All three are consistent with blog post portfolios we've looked at many times and employ the idea of leveraging down. 


The fourth one is the United Sovereign Wealth Fund ETF I made up the other day except with 4% to Bitcoin as I included in that blog post, and I threw in the Vanguard Balanced Index Fund as a benchmark.


The study period is just year to date but only goes through March 7th. 


The HOOD/NVDA barbell would be down more, HOOD got pasted on Monday but none of the portfolios are catastrophically bad. SPYQ is a levered 2x SPY fund that resets quarterly. Being the middle of the quarter it is down more than 2x SPY. Of the four portfolios we created, the one with SPYQ is the worst of the bunch, down 14 basis points, just a whisker better than VBAIX. The portfolio with NTSX is getting a little help from BTAL which was up 10% YTD as of the end of last week.

When I wrote about the HOOD/NVDA barbell the other day I made the point about the higher flying stocks already being up a lot and saying the idea would hinge on picking correctly going forward but that it might be more plausible going with a sector like tech or an industry like semiconductors and tweaking the numbers. 

One skew favorably impacting Portfolios 2 and 3 is the inclusion of AQMIX for managed futures. We use that one for blogging purposes all the time but its long term record is very middle of the pack. This year though it's having a turn as one of the best performers and is up a little for the year. If we'd used a different managed futures fund, I imagine those two portfolio would have been down slightly YTD. 

To answer the question in the title of this post, did capital efficiency fail on this test? The versions we play around with don't appear to have failed. The more practical application is understanding that most of the return for a portfolio that goes narrower than a couple of broad based index funds will come from just a few holdings. 

Whatever you own in the utility sector for example is unlikely to be a leader in the portfolio over any longer term period. My experience with Next Era Energy (NEE) included a good bit of luck and a result that probably won't repeat. Be careful backtesting anything with a utility sector fund, there's a 17 or 18 year stretch in there where NEE went up 850% which skewed funds like XLU. The reason to bring that sort of unrepeatable performance up is that if you do this sort of portfolio studying and you get a real outlier, either favorable or unfavorable, it makes sense to figure out why. 

If you notice, a lot of what we play around with gets very similar results. I think that helps make the results both explainable and repeatable. We had this come up just the other day in the US Sovereign Wealth Fund ETF post, I backtested with 1% Bitcoin because I don't think those results can be repeated but in going forward I suggested 4% (for blogging purposes only not in real life). That's also why I stuck with managed futures in today's post where consistent with previous posts even though most of the funds are having a rough time.

The information, analysis and opinions expressed herein reflect our judgment and opinions as of the date of writing and are subject to change at any time without notice. They are not intended to constitute legal, tax, securities or investment advice or a recommended course of action in any given situation.

Monday, March 10, 2025

Huge Learning Opportunity Today

Today was a rough day for markets as we talked about this morning and then it got worse throughout the day. As I write this around 6pm AZ time, futures are down another 48 basis points. The learning opportunity from the title of this post relates to how various holdings do during events like this. I wouldn't necessarily draw a specific conclusion, more like accumulating data points.

It's one thing to look at a backtest but it's another thing to take an inventory in real time during an event like the one we are going through now. If we were just going by backtests, we'd be heavy-heavy into managed futures but as Jose Ordonez pointed out, enduring through with managed futures can be very difficult. Maybe things will turn around for managed futures but if you use alternatives and you use managed futures, it is runs like this one that are why I pound the table on diversifying your diversifiers. It's incorrect to say they aren't working, but right now, managed futures isn't helping. 

The symbols are all funds we've talked about here before. The only one to disclose is FIRS, I own a few shares, it's a quadrant style, multi-asset fund but it has more beta than something like Risk Parity RPAR and what I think Bridgewater All Weather (ALLW) will have. Based on the bid at the close, FIRS was down more like 2% not 1.58%. TRTY is also all-weatherish. Good that TRTY was down less but its growth rate is less than half that of Vanguard Balanced Index (VBAIX). 

The Permanent Portfolio Fund (PRPFX) did a little better than VBAIX which was down 1.45%. 

YSPY is a new put selling fund we've been looking it. It has had rough luck with regard to it's timing, launching into a nasty decline. FWIW, the WidsomTree PutWrite Strategy ETF (PUTW) was down 2.4%. 

I included Alpha Architect Tail Risk ETF (CAOS). Like we just mentioned the other day, it avoids the bleed of tail risk strategies but doesn't seem that sensitive to declines in the S&P 500. If I owned CAOS, I think I'd be hoping for a bigger lift than that. I have a macro fund in my ownership universe that was up more than CAOS today and since this decline started it is up about 3% versus a few basis points for CAOS. Macro shouldn't be expected to have a negative correlation, I would hope it is uncorrelated which could result in a nice run like it has had but it could have gone the other way. The Cambria Tail Risk Fund (TAIL) was up 3.54% on Monday.

RSST had a rough day but interestingly, RSSY which is stocks and carry was up over 2%. 

Putting it all in.....whatever broad based vehicle like VBAIX or PRPFX and maybe TRTY if you can live with a low CAGR is valid or putting it all into a broad market equity fund but there will be market events that will cause you to have some regret, hopefully just temporarily. But if you're reading a blog like this one you are probably more engaged than that, maybe you would call yourself a student of the market, I certainly think of myself that way. 

These types of events are guaranteed to come along every so often and if you think you might be a student of the market then I would encourage you to treat this as a learning opportunity and use it to become a more knowledgeable investor. 

The information, analysis and opinions expressed herein reflect our judgment and opinions as of the date of writing and are subject to change at any time without notice. They are not intended to constitute legal, tax, securities or investment advice or a recommended course of action in any given situation.

Manic Monday

It's an ugly Monday morning open. Last Monday I suggested getting "mentally ready for more deterioration in equities and be happy to be wrong." So there has been more deterioration.

I understand not believing in holding first responder defensives but I think having some weighting to differentiated return profiles is crucial to build proper diversification. I've been on this train since before the Financial Crisis but now it is much easier to build out this small part of a diversified portfolio with more sophisticated products having hit the market over the last 15 years.

This event continues to be tough for managed futures, DBMF and KMLM as examples, which is why they are better thought of as second responders, more likely to protect against a longer slower decline.

We can't know where this event is going obviously but it has been pretty fast and fast declines have the tendency to snap back quickly once they are over....again though, we have no idea when this will be over and a tendency is not a certainty. 

SH, BTAL, GLDM, CBOE and NOC are all in my ownership universe, DBMF and KMLM are not. And FWIW, staples are higher today too which like the other day makes sense as a somewhat defensive sector but that could be more about the drop in treasury yields today because also like the other day, REITs appear to be higher too. 

The information, analysis and opinions expressed herein reflect our judgment and opinions as of the date of writing and are subject to change at any time without notice. They are not intended to constitute legal, tax, securities or investment advice or a recommended course of action in any given situation.

Sunday, March 09, 2025

Dividends' Day In The Sun

The Wall Street Journal has an article up this weekend about investors rotating to dividend centric stocks and funds because they are doing well in 2025 as market cap weighting has struggled, especially since mid-February. 

The Schwab US Dividend Equity ETF (SCHD) seems to garner the most attention. If you read the comments on various articles (always read the comments) there will frequently be at least one comment that says "put it all in SCHD and forget it." 

Dividends are a factor similar to momentum, quality and the others. It's a good bet that each factor will have its time in the sun relative to other factors. Dividend investing certainly has had it's share of relatively good years but there will also be the occasional year where it will lag badly. In 2023, SCHD was up 4.57% total return, 78 basis points on a price basis while the S&P 500 was up 26.19%. Of course the year before, the S&P was the stinker while SCHD was only down 3%.

A portfolio strategy that goes narrower than a couple of broad based index funds probably has some exposure to dividend stocks already so the decision about whether to make any changes can be moot, you already have some exposure. Maybe you have enough to capture the effect or maybe not but if a portfolio is reasonably diversified, they're already in. 


The blue line and the purple line are dividend stocks in my ownership universe. Yes, they're doing well this year but they are both very long term holds and when dividend stocks underperform, these two typically underperform. However long this good run for dividend stocks lasts, I expect they'll participate and that the next time dividend stocks underperform they will too. I believe they are both great companies but no great company can always have the best stock performance. Knowing they cannot always be best, I mean really understanding that reality makes it much easier to hold them when they are lagging. 

In late January we took a quick look at RDMIX after it changed its strategy to become the ReturnStacked Balanced Allocation & Systematic Macro Fund. The strategy is now also an ETF in Canada, they sent out an email promoting the ETF which was a good prompt to play around with it a little more thoughtfully. The fund puts 50% into global equities, 50% into core bond exposure (100% into balanced allocation) and then 100% into systematic macro. It's a fascinating idea, all their ideas are fascinating and maybe there is something to learn from the allocation. 


You can see how I built the core. I don't want to use AGG-like bond exposure so we're using these substitutes. The allocation mix is true to RDMIX/the Canadian ETF. The backtest includes a leveraged version like putting 100% of a portfolio into RDMIX/the Canadian ETF which is not how they intend it to be used, the above leveraged version and then Portfolio might be a way they do intend it to be used.


To be clear, Portfolio 3 does use the portable alpha approach, it is leveraged by 40%. The alts in the leverage sleeve all have a low to negative correlation to equities and to each other. BTAL is a client and personal holding. Portfolio 3's worst year was 2018 when it fell 7.76%. Portfolio 2 had two years where it was down 5% (those were the worst two) and the leveraged version's worst year was 2018 when it fell 12.26%.

When we do these exercises, I'm not really trying to find something that will compound miles ahead of plain vanilla, the objective is more about smoothing out the ride and trying to build a portfolio that will have a robust result in the face of a market event like in 2022 or maybe even a fast decline like the 2020 Pandemic Crash. Interestingly, Portfolio 3 was only down 6 or 7% in the 2020 Pandemic Crash but for the year, it was that portfolio's weakest up year in the backtest if that makes sense, up less than 5% versus 16% for VBAIX. The Calmar Ratios for all three are much higher than VBAIX but the kurtosis numbers a slightly inferior. 

The idea seems to have merit, maybe we should call it the Homemade Hedge Fund. There is no reason anyone trying to implement some variation of this needs to put such a huge weighting into just one fund, EBSIX in this case, for the macro component. EBSIX' worst 12 month stretch was a decline of 13% from June 2013 to June 2014. While that is not a catastrophic number, it's a visible risk that seems easy to mitigate. 

ETF Hearsay tweeted that the Brookmont Catastrophe Bond ETF will start trading under the symbol ILS. ILS stands for insurance linked securities. Here's the site for the fund but there's nothing on it yet. Wes Gray from Alpha Architect replied with some skepticism about cat bonds working in an ETF wrapper. Dave Nadig chipped in noting the 1.58% expense ratio but that is in the middle of the pack of funds. I'll be curious to see if cat bonds can work in an ETF.

The information, analysis and opinions expressed herein reflect our judgment and opinions as of the date of writing and are subject to change at any time without notice. They are not intended to constitute legal, tax, securities or investment advice or a recommended course of action in any given situation.

Saturday, March 08, 2025

Tail Risk & MOVE

Matthew Tuttle talked about this a couple of weeks ago but his firm just filed for the Tuttle Capital No Bleed Tail Risk ETF. The name of the fund refers to the tendency of tail risk strategies to lose a lot of money waiting for the next disaster. There aren't too many tail risk funds out there. The Cambria Tail Risk ETF has been around for a long time and its chart captures the bleed that the proposed Tuttle fund is trying to avoid. 


The other fund that I am aware of is the Alpha Architect Tail Risk ETF (CAOS). That seems to avoid the bleed issue and while it did react well during the Great Dip Of Early August 2024, it doesn't seem to be very reactive when the S&P 500 goes down,


The Tuttle fund will mix long volatility via VIX products, use S&P 500 option combos for both income and downside protection and try to take advantage of VIX term structure (carry) when possible, all with an assist from AI. You can read the prospectus for more details. 

Trying to do anything with VIX is very difficult. I believe it was the VIX strategy in the Simplify Tail Risk ETF (CYA) that blew that fund up. Between TAIL, CAOS and CYA, the ticker symbol game is very strong in this space but the Tuttle fund may have the best one.....OHNO. How great is that?

I'm so inspired by OHNO that I have decided to launch my own tail risk fund and the symbol will be OCRP. I assume the SEC wouldn't greenlight SHIT so oh crap OCRP it is. OCRP will have 50% in CBOE Holdings (CBOE) and 50% in AGFiQ US Market Neutral Anti Beta ETF (BTAL) which are both client and personal holdings. If they can have single stock ETFs why not an ETF with just two holdings?


I threw tail in as well as the S&P 500. In late 2018 OCRP moved up when the market had a fast drop. It did go down almost 9% in the 2020 Pandemic Crash but that was just a fraction of what the S&P 500 dropped and in 2022, OCRP was up 9.15%. You can see a couple of other shorter S&P 500 declines where OCRP went up. Portfoliovisualizer says OCRP has a -0.09 correlation to the S&P 500 and the Calmar Ratio and kurtosis both look pretty good too. 

This is tongue and cheek of course, I am not going to launch an ETF with two names that I've been blogging about forever but maybe this crystalizes the effectiveness of very simple first responders. I did not include an inverse index fund in OCRP because it has no chance of going up if the market is rising where OCRP clearly can go up. 

Barron's has a useful article recapping research from Paul Marsh, Mike Staunton and Elroy Dimson. You might recognize that third name. One of their conclusions was that bonds stink but you probably need them. Part of their logic is the supposedly low or negative correlation to stocks. As we've pointed out, that low or negative correlation to stocks has become unreliable and the volatility as measured by the MOVE Index entered a new regime in 2022 and has remained very high ever since. 

Invoking Karl Popper, if it only takes one negative to disprove a theory, what about several hundred blog posts disproving the need for bonds? There are many different and diverse ways to get exposure to segments and strategies that reliably offer the yield and very low volatility that people hope to get with bonds.

The information, analysis and opinions expressed herein reflect our judgment and opinions as of the date of writing and are subject to change at any time without notice. They are not intended to constitute legal, tax, securities or investment advice or a recommended course of action in any given situation.

Friday, March 07, 2025

Follow Up Friday

Let's start with a couple of follow ups. 

It looks like the GraniteShares YieldBoost SPY ETF (YSPY), the fund that sells put spreads on the Direxion 3X SPY (SPXL), readjusted its spread down to slightly lower strike prices, it shows being short 170.87 and long 157.20 that expire today. Unfortunately, SPXL is trading with a $147 handle as I write this. So either it will take the loss or more likely it will roll down again which might be expensive to do. Selling volatility is a valid strategy but it is very tricky to do. The timing for YPSY's launch is unfortunate for sure, but it is too early to draw a definitive conclusion beyond yeah it's risky and volatile

Next, the SPDR Bridgewater All Weather ETF (ALLW) did have some changes overnight. Yesterday I think I missed the full roster of holdings and now the website shows the notional percentages of assets it owns.

Most of the global nominal bond allocation is with futures contracts, same with commodities. Equities are mostly SPDR ETFs and the inflation linked bonds are individual issues. Obviously the fund is leveraged which is consistent with risk parity. Mid-day, the fund is down a little in what was an ugly tape for equities. 

Fidelity has a portfolio analysis tool for advisors that I tried out this morning. I put in a 6 fund portfolio that is consistent with funds we use for blogging purposes and compared to the Fidelity Target Allocation 60/40 Model Portfolio. The Fidelity model had 15 funds plus 2% in a money market.


Giving them the benefit of the doubt, I would guess the Sharpe Ratio is better than -0.03 and the Sharpe Ratio for the Test Portfolio is higher than 0.49 on Portfoliovisualizer. I will play around with this more but it does reiterate a point that you can build a robust portfolio without needing 15 funds.


These four domestic equity funds add up to 25% of the model. It's diversification without a difference. It's probably not ok to reveal the funds other than a generic S&P 500 fund but there's no reason, that entire 25% could be in FXAIX.

Lastly, one of the Bloomberg pre-market emails talked briefly about people being unable, financially, to retire, that continuing to work is their Plan A. Coincidentally, I got my annual email from the Social Security Admin with my updated numbers. An important point to reiterate is they want us to know what our numbers are

You can go get your numbers. It's not too difficult to understand how far your expected benefits will go relative to your expenses and other preferred lifestyle needs. Are you 50 or 60, whatever age, you probably have some idea of when you hope to retire, if that is your preference. So it boils down to math on a spreadsheet. If the numbers don't look favorable or there's not enough of a margin of safety for you to be comfortable, what can you start doing now to fill the gap? 

Think your payout will get cut? Ok, do the math, where does that leave you? There of course has long been the threat of a 21-23% cut starting in 2034/2035. While I am skeptical that it will ever get cut, the easiest way to implement a cut would be to eliminate the spousal benefit. In my scenario, spouses would still get the survivor benefit. 

There's nothing new from me on this, just the reminders that they do want us to know what our numbers are and that no one will care more about our retirement outcome more than us. 

The information, analysis and opinions expressed herein reflect our judgment and opinions as of the date of writing and are subject to change at any time without notice. They are not intended to constitute legal, tax, securities or investment advice or a recommended course of action in any given situation.

I Made A Bored Ape!

Remember NFTs, bored apes and pudgy penguins? "Ryder Ripps" shared his story on Twitter about buying the following bored ape a fe...