There was a mention of this year's Magnificent Seven Stocks in Barron's this week. You're probably aware that this group has wildly distorted the return of the S&P 500 this year accounting for most of the gain. Here's a chart from Portfoliovisualizer where Portfolio 1 is the Seven, Portfolio 2 is the Vanguard S&P 500 ETF (VOO) and Portfolio 3 is the Invesco S&P 500 Equal Weight ETF (RSP) all YTD.
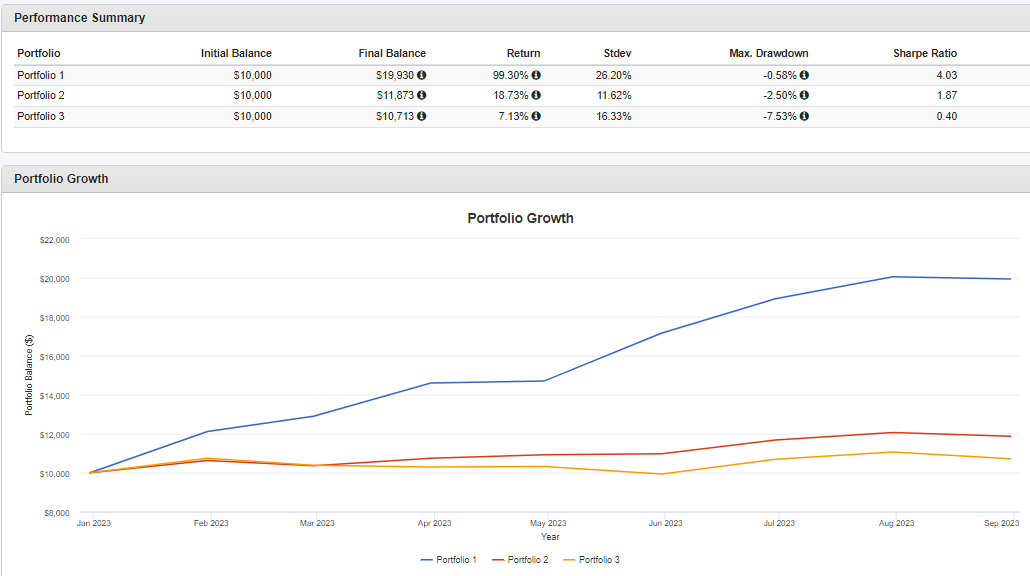
The 7.13% for RSP through 8/31 captures how the average stock in the index has done this year. The Seven are Amazon, Apple, Google, Meta, Microsoft, Nvidia and Tesla. This all sent me down a little bit of a rabbit hole exploring different ways to access technology or picking the sector as a path to leveraging down.
First, there is a S&P 500 Ex-Tech ETF, so it owns the S&P 500 minus the tech sector, that trades with symbol SPXT.

SPXT plus the Tech Sector SPDR (XLK), weighted in correct proportion should equal VOO. It's close as you can see and SPXT has, not surprisingly, lagged far behind the full index. The tech sector's massive weighting gives an opportunity to carve it out and explore some return stacking ideas as a tool to leverage down trying to find a better risk adjusted return. I should note that the tech sector under the old weighting system, before they revamped the communication sector to include Google, would be more like 36% of the index.
A 50/50 split of the ProShares 2X Ultra Technology Fund (ROM) and cash should equal 100% into XLK. The difference is the daily reset of ROM.

ROM plus cash is the red line. There can be no assurance that it will continue to outperform but 50% in ROM is close enough to 100% in XLK for this post. Here's one idea to use ROM to leverage down, hedging with client/personal holding AGFiQ US Market Neutral Anti Beta ETF (BTAL).

It's incremental but still slight outperformance with slightly less volatility. Sometimes when we build these sorts of things, you can see in the year by year where one year like 2022 accounts for a disproportionate amount of long term outperformance. Not so here. With the weight to BTAL, Portfolio 3 did outperform in 2022 but by less than 200 basis points against both Portfolios 1 and 2. So a little bit of defense but the track record is a pretty close proxy to the S&P 500 in each year. Note that Portfolio 2 in this chart should be a very close proxy even if not exact so the thing we're exploring is whether leveraging down to add some hedging helps.
You can decide for yourself if that is worth it but this is a useful reiteration that volatility can be managed by using strategies with low and negative correlations to plain vanilla equity exposure.
Next we add Managed futures at the expense of SPXT as follows

The results are compelling. It out performs VOO in Portfolio 1 and brings down the standard deviation by 250 basis points which is kind of a lot for this sort of exercise.

It is sort of a quest for me to play around with these numbers and weightings as I think it helps me to continue to learn. I saw a great quote attributed to Isaac Asimov that says "education isn't something you finish"
The information, analysis and opinions expressed herein reflect our judgment and opinions as of the date of writing and are subject to change at any time without notice. They are not intended to constitute legal, tax, securities or investment advice or a recommended course of action in any given situation.


No comments:
Post a Comment