Thursday, October 31, 2024

Enduring The Languishment

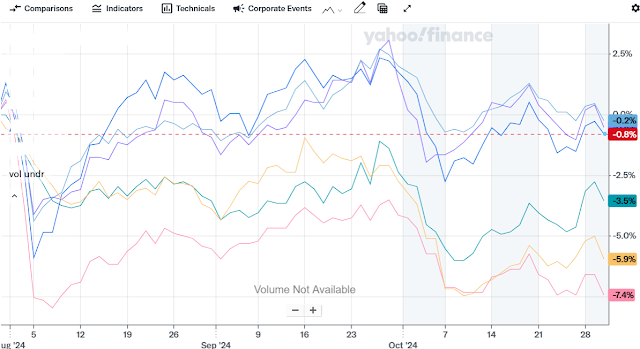
Jeff Malec from RCM Capital Tweeted the following series of charts to help frame what has been going on with managed futures. 


Here's a sampling of what some of the funds have been doing over the same period.


The names don't matter, the group has been grinding around. It may not feel like it but in the same period, the S&P 500 is up almost 5% even though it was pretty flat in October. A few months of grinding around is nothing new if you've been involved with the space for awhile. But what about that five year stretch where moreso than grinding around they were grinding down? For five years. 

If you read posts here regularly, for as much as we talk about managed futures, it seems reasonable to think you might have some interest in managed futures too. Where managed futures are not the thing that goes up the most, most of the time, I think it is helpful to chronicle the periods where managed futures struggles. There was (still is?) all that content about putting a ton into managed futures, the current period is the dark side, the downside of doing that. 

Normalizing the periodic struggles of managed futures makes the struggles easier to endure. Oh yeah, managed futures can struggle for months or years at a time. Any strategy or tools you employ will have tradeoffs and one of them for managed futures is they can languish for quite a while. 

The information, analysis and opinions expressed herein reflect our judgment and opinions as of the date of writing and are subject to change at any time without notice. They are not intended to constitute legal, tax, securities or investment advice or a recommended course of action in any given situation.

Wednesday, October 30, 2024

The Permanent Portfolio Influences Everything

Man Institute had a short post titled Not All Alts Are Created Equal. The paper itself wasn't too in depth but they did provide a little bit of a framework for portfolio construction with alts. They suggested 50% in "dynamic traditional assets" which is some combination of "risk managed" stocks and bonds. They didn't provide detail for what they meant by those terms. They would put the other half in a combination of trend following and market neutral and although they didn't say it I took it as 50/50 between the two alt strategies. 

That sort of reminds me of the Permanent Portfolio or at least inspired by the Permanent Portfolio which allocates an equal 25% to equities, long bonds, gold and cash. The big idea is to have uncorrelated return streams or more simply, always having at least one thing going up no matter what is happening.

Not an original thought from me but almost all of these portfolios we look at and play around with here are inspired by the Permanent Portfolio. Obviously, I am pretty down on the diversification benefits of long bonds and Man may have dug up a contributing factor to support my opinion. They note that correlations between equities and long bonds go up when price inflation persists above 2.7%. It has been so long since inflation persisted above 2.7% that I don't know if that stands up but maybe and either way, getting a yield in the fours for 10-20-30 years seems like uncompensated risk or maybe better to say, inadequately compensated risk. 

Each of the following have 25% allocated to AQR Diversified Arbitrage Fund (ADAIX) for market neutral and 25% allocated to American Beacon AHL Managed Futures (AHLPX). You can see the rest of the allocation of the three portfolios and I benchmarked to the Permanent Portfolio Mutual Fund (PRFPX).


The version with VOO is straightforward, market cap weighted equities. SPMO is the Invesco S&P 500 Momentum ETF which has a higher standard deviation which could be thought of having the effect of increasing the equity exposure a little bit but fair if you disagree. NTSX is the WisdomTree US Core Efficient ETF also known as the 90/60 ETF. It leverages up such that a 67% allocation to the fund equals 100% into a 60/40 fund like VBAIX. Putting 50% of Portfolio 3 into NTSX adds capital efficiency (leverage) to the mix, it leverages up 25%.

The CAGRs and standard deviations are all close with a series of small tradeoffs. The version with SPMO compounds 96 basis points higher than the version with VOO but the SPMO version is more volatile by 33 basis points. That's probably worth it but it's not night and day better. The version with NTSX has considerably lower volatility but the CAGR is also quite a bit lower. The numbers for Calmar Ratio and kurtosis are more interesting. Calmar Ratios: Portfolio 1 1.05, Portfolio 2 1.17, Portfolio 3 0.53 and PRPFX is 0.67. For Calmar, higher is better. For kurtosis: Portfolio 1 -0.06, Portfolio 2 -0.60, Portfolio 3 -0.35 and PRPFX is +0.61. Lower is better for kurtosis.

Calmar Ratio and kurtosis are fancy words for similar concepts and can be useful points of understanding. Calmar measures the risk of large losses and kurtosis captures vulnerability to negative, outlier events. The Calmar/kurtosis make sense if you believe in using alternatives. That stats show them providing protection that PRPFX doesn't necessarily do. That fund diversifies with gold and to a lesser extent silver. The other day I mentioned gold as being a less reliable second responder than managed futures and I think we might be seeing that in the metrics. 

Here's a fun study using the VOO version above compared to a different idea using client/personal holding Standpoint Multi-Asset (BLNDX).


Hopefully it goes without saying that I'm never putting anywhere near 85 or 90% in BLNDX. Bitcoin went down a ton in 2022 and then bounced back pretty hard in 2024 and is merely having a very good year in 2024. The effect of including Bitcoin adds 133 basis points to the growth rate but the tradeoff is to increase the volatility by 178 basis points. In terms of risk adjusted returns Bitcoin didn't help but that would change if Bitcoin went on another tear. BLNDX has the attributes of a core holding and catastrophe bonds are very handy at suppressing portfolio volatility. 

The allocation to Bitcoin (asymmetry) is small enough that a 64% decline in 2022 really did not hurt Portfolio 1, it was only down 39 basis points that year. Portfolio 2 is interesting, it is far ahead of VBAIX with much less volatility. It also did better than Portfolio 3 but longer term, I would expect it to lag VBAIX for sure, but with less volatility, and I think it would lag Portfolio 3 but am less certain of that. I think it could be close in most years and take turns being the outperformer but in 2023 when the market was up a lot it trailed VBAIX by 1000 basis points. Maybe I'm wrong about Portfolio 2 lagging though, this year, it is ahead of VBAIX by 200 basis points.

Interestingly the Calmar ratios for portfolios 1 and 2 are very good but kurtosis numbers are not good. Can't please everyone. 

The information, analysis and opinions expressed herein reflect our judgment and opinions as of the date of writing and are subject to change at any time without notice. They are not intended to constitute legal, tax, securities or investment advice or a recommended course of action in any given situation.

Tuesday, October 29, 2024

What Is A FIRE Portfolio?

Fund provider Tidal/ETF Masters, more of a white label than an actual provider, had a fun article titled Building A Financial Independence/Retire Early Portfolio With ETFs. The article spells out several alternative strategies to build out a portfolio once you achieve FIRE. 

First, if you've just retired early and plan to draw from an investment portfolio for the next 40 or 50 years, do not load up on a bunch of alternatives that aren't intended to provide something that looks like stock market growth. I'm assuming the situation is someone probably has enough to make it work as opposed to some sort of massive windfall where someone lives a $200,000 lifestyle but has $20 million in the bank. 

In a post over the weekend, we looked at an alt-heavy portfolio to provide high income for nine years. The backtests didn't deplete because market returns were relatively high. Neither did a 10% withdrawal rate deplete an account that just owned the S&P 500, it actually grew in the period we studied. If you expect that your FIRE portfolio will have last 40-50 years then focus on equities, have a decent amount of cash for expected expenses set aside and if you believe in using alts, have small exposures to smooth out the ride a little.

Tidal/ETF Masters talked about risk parity, managed futures, hedge fund replication, inflation protection and derivative income funds. They didn't name names or talk about weightings. Risk parity is really a tough one to invest in at the fund level. This history supporting it is good but that is because bonds had a 40 year bull market. If I am correct about bonds with duration now being a source of unreliable volatility then I'm not sure how a retail-accessible fund would be able to do the job. 

Quick pivot to catastrophe bonds thanks to a short report about the impact of Hurricane Milton. First here's how the three devoted funds in the space have done.


I threw iShares 7-10 Year Treasury ETF (IEF) in for a little context. The report was sent out by EMPIX which is a fund that I am test driving for possible client use. EMPIX and CBYYX have pretty much recovered back to their respective trend lines, maybe a little short of the mark. The drop in mid-September for SHRIX was actually a dividend reduction not a price drop. Hurricane Ian back in 2022 had a bigger impact on SHRIX which as best as I can tell was the only fund in the space back then. SHRIX fell 10% from Ian. 

The threat of the hurricane as it was approaching land caused some markdowns in bond prices. It's not ok to share a lot of detail from the report but one stat to mention is that the benchmark Swiss Re Global Cat Bond Total Return Index only fell 1.34% at its worst. I am less familiar with SHRIX and CBYYX but EMPIX' literature goes out of its way to talk about really trying to tamp down volatility and risk relative to other cat bond portfolios. If you look at longer term stats of the funds on Portfoliovisualizer, that doesn't really appear to be the case but as for the eyeball test during Milton it does appear to have been less volatile thank the others.

All three though have very little volatility and all three have a slightly negative correlation to equities. I mentioned in an earlier post about cat bonds that the thresholds for triggering events, the dollar amount at which the bonds pay out which is bad for bond holders, tend to be very high. The report from EMPIX did not say there were no triggering events in Milton, or Helene for that matter, but the daily updates they sent out when the hurricanes were actually hitting made no mention of triggering events and the snapback in the fund prices imply there were no triggering events. 

Going through this today, I tried to track down the status of the Brookmont Cat Bond ETF which will have symbol ROAR if it lists. I found no news saying there was a problem so maybe it's as simple as not wanting to list the fund during hurricane season. 

The information, analysis and opinions expressed herein reflect our judgment and opinions as of the date of writing and are subject to change at any time without notice. They are not intended to constitute legal, tax, securities or investment advice or a recommended course of action in any given situation.

Monday, October 28, 2024

"Diversification Without Risk Management"

On Monday afternoon I sat in on a webinar put on by RCM Alternatives with Jon Robinson from Blueprint Investment Partners and Jerry Parker who is a pioneer in trend following with managed futures. The two partner on the Blueprint Chesapeake Multi-Asset Trend ETF (TFPN). Parker also partners with Cambria on the Cambria Chesapeake Pure Trend ETF (MFUT).

The most interesting part of the webinar came at the end with a couple of comments from Robinson. Blueprint worked with Parker from when Parker ran strategies as a hedge fund and has been a believer in the importance of trend and managed futures for a while. When they talked about portfolio allocations he said they want to have enough in managed futures to have an impact on the portfolio. He pegged that number at 25% or 33% but conceded even 5-10% could help. 

One interesting thing about TFPN is that it has a low correlation to other managed futures funds as well as a low correlation to equities. I asked why that was and they believe it's because of how they size positions and also because they use longer/slower signals than most other managed futures programs. TFPN is only 15 months old, if it turns out to be yet another uncorrelated return stream (uncorrelated to not just equities but also other diversifiers) cool but I don't think 15 months is a enough time to draw a conclusion on that. 

We've done this before, but let's see what 25% to managed futures looks like but instead of picking one fund and dumping 25% in, I will split it up with 5% weightings to five different funds. The differences in things like risk weighting, position sizing, length or combination of signals can cause some fairly big dispersion between funds. As we saw the other day, that dispersion between funds didn't prevent them from collectively going up a lot in 2022. 

Portfolio 1 as follows


Portfolio 2 is 50% VOO and 50% iShares 7-10 Year Treasury ETF (IEF). Over the weekend I stumbled into the S&P Balanced Equity & Bond Index-Moderate which is seems like a useful benchmark for blogging purposes and is 50/50 S&P 500 and 7-10 year treasuries. Portfolio 3 is Vanguard Balanced Index Fund (VBAIX) which of course is a proxy for a 60/40 portfolio.


The correlation between the various managed futures funds is interesting. You wouldn't say they are lowly correlated but the correlations aren't that tight so maybe there is some insulation  against things going wrong versus putting 25% into just one managed futures fund. 


We looked at a similar chart the other day. All five funds really struggled from 2015-2020 but there was variation among the five. This five year run is included in the backtest and obviously they weighed on returns, you can see the lag, but the longer term result was competitive.  


Portfolio 1 lagged in most years but stayed close and then moved ahead when managed futures did well in 2021 and 2022. Staying at least sort of close is important. If you think the long term CAGR is compelling, good but the more interesting thing to me is how much lower the standard deviation is as well as the kurtosis which is captured on the metrics tab of Portfoliovisualizer. Portfolio 1 is 0.06, VOO/IEF is 0.61 and and VBAIX is 0.69. Kurtosis captures susceptibility to adverse outlier events and lower is better with this number. Also the Calmar Ratio is dramatically better, 2.0 versus 0.24 and 0.27 and for this one, higher is better. Calmar captures risk of significant losses. 

The other day when I posted a chart similar to the one above where managed futures went down for five years, I said it was generally doing what it was supposed to, maintaining its negative correlation to equities and I asked "would you want 25% in managed futures" during that period. Maybe, that wouldn't have been so bad. 

The tendency toward negative correlation has certainly held up more often than not in my time with managed futures going back to 2007 when RYMFX first started trading as Rydex Managed Futures. This gets us to the title of the post and Robinson's comments around how much to allocate to managed futures. As you dig in and learn more about the systematic nature of managed futures and the other elements of the strategy, you see how important risk management is to the strategy. Yes but I think in terms of the portfolio, I believe managed futures helps to manage the risk of the portfolio. Robinson made a comment almost in passing about the typical stocks and bonds mix being diversification without risk management. If you are well diversified you always have things going up and things going down. If they all go up together, they can all go down together.

You might agree or disagree with that but his point really resonated. 

The information, analysis and opinions expressed herein reflect our judgment and opinions as of the date of writing and are subject to change at any time without notice. They are not intended to constitute legal, tax, securities or investment advice or a recommended course of action in any given situation.

Sunday, October 27, 2024

Depletion Bucket

This post will revisit an idea we have touched on a few time before. The textbook order from which retirees "should" draw from is taxable accounts until depleted, then traditional IRAs until depleted and finally Roth IRAs. Frequently, they never get to the Roth and that can be part of the estate. This has to do with taxes and RMDs but it is very generic. There are countless circumstances where someone should take a different path.

The idea today focuses on the circumstance where the retiree is willing to deplete their taxable account because they want to let their Social Security payout grow or maybe want to wait until they have to withdraw from their IRA or maybe have to wait for their pension to kick in. This sort of circumstance probably wouldn't be too many years unless someone in their mid-50's had their hand forced with their work (layoff or health issue). 

We'll work with what starts as $250,000 in a taxable account that will take $25,000 out annually where the retiree in question is willing to deplete the account. Let's say this person is 61, just retired, prefers to delay starting Social Security until age 70 and will take RMDs at 73 but could take IRA withdrawals earlier if the taxable account depletes. 

I chose Global X S&P 500 Covered Call ETF (XYLD) and Global X NASDAQ 100 Covered Call ETF (QYLD) so that we could get a full ten year backtest. Putting it all in the SPDR T-Bill ETF (BIL) depleted after 9 1/2 years. If it matters, I actually built the withdrawal to be $6250 per calendar quarter. 

Portfolio 1 includes an S&P 500 index fund to provide a little, regular equity market growth. XYLD and QYLD haven't come anywhere close to keeping with with plain vanilla market cap weighted indexes. With dividends reinvested, they have captured half the S&P 500 for the last ten years and without reinvesting they have compounded negatively. 

After ten years you can see how much is still in each portfolio. Even Portfolio 2 which compounded negatively and with a 10% withdrawal rate might still have four more years of life in it. Even VBAIX is in very good shape for a bucket that only needed to last for nine years. 

The portfolios were very successful versus needing to last nine years but of course they benefitted from a strong stock market. It was up nine out of eleven full and partial years, there was a third year where it was barely up which is all pretty close to the rule of thumb about the stock market having an up year 72% of the time. It compounded a little higher than average in that time at 11.32%.

The risk I am getting to in the above paragraph is that stocks don't do as well as they did in the previous ten years. That's tough to model in Portfoliovisualizer, please leave a comment if you know of a way, so to stress test the idea, we can increase the income from $25,000 up to $35,000. When we do that, Portfolio 2 depletes after eight and a half years, VBAIX depletes after nine years and two months and Portfolio 1 depletes at nine and half years. If this depletion strategy had been implemented with putting it all into the S&P, with the $25,000 withdrawals, the balance would have grown to $296,000 and with $35,000 withdrawals would still have $65,000. 

When I had the idea for this post, it didn't occur to me to just put it all in an index fund. I figured that some version of the portfolios we build with the covered call funds would work. Putting it all into an S&P 500 index fund would run into trouble if the period in question included a 2008 when the index cut in half. Also the capital gain potential isn't that much better than one of the depletion portfolios we build because the derivative income funds often include returns of capital which of course are not taxable on the front end but they do lower your cost basis. There are now so many different types of derivative income funds that it would be possible to diversify strategies to take a little less risk. 

It is worth pointing out that all of the dialog about 4% withdrawal rates is built around sustainability over a normal retirement duration which most people peg at around 30 years, at least that is the typical timeline for planning purposes. Talking generically, for someone for whom a depletion bucket makes sense, they are leaving their IRA alone for some number of years to keep growing. In our example, if the depletion bucket lasts for nine years, that could reasonably be enough time for the equity allocation to increase 50-100%. Since 2014, the S&P 500 has almost tripled so 50-100% for the equity portion of a diversified portfolio is not insanely unrealistic. Yes, there is absolutely the possibility that the period that someone needs to do this looks like the 2000's or maybe David Kostin of Goldman Sachs will turn out to be right about 3% annualized growth over the next 10 years. But what retirement plan doesn't need some level of resilience in the face of some sort of adverse market sequence? 

The information, analysis and opinions expressed herein reflect our judgment and opinions as of the date of writing and are subject to change at any time without notice. They are not intended to constitute legal, tax, securities or investment advice or a recommended course of action in any given situation.

Saturday, October 26, 2024

What To Do When The Bitcoin Math Doesn't Math

Here are the top holders of Bitcoin.

Satoshi plus the ETFs own about 10% of the 21 million Bitcoin limit. The supply is fixed at that amount with most of the available having been mined but because of the halving process, the final Bitcoin won't be mined for decades. Should the almost 10% owned by two constituencies (I am lumping all the ETFs together) be concerning in any way? That roughly two million Bitcoin is actually more than 10% because approximately 3.8 million Bitcoin are lost forever due to lost hardware or passwords. That number is from a Bankrate article I found on a Google search. I'd be curious to hear if anyone else does the same search and finds a different number of lost coins. 

How much Bitcoin, if any, do you own. I had a very lucky purchase in late 2018 and although I have rearranged how/where I own it, I haven't sold. As I've been saying, I will hold it until it grows into a life changing piece of money or until it craps out, I've described that as betting on the potential asymmetry.

In looking around on Google, I see estimates ranging from 20% of the US adult population owning at least a little Bitcoin ranging up to 40% with the average estimated amount owned equating to a couple of hundred dollars. That 40% could own Bitcoin makes no intuitive sense to me, I guess 20% is possible but that too seems a little high but who knows? 

There were 127 million US households as of 2022. So 25 million of them own a little Bitcoin worth a couple of hundred dollars? That obviously is nowhere near enough of a dollar equivalent value to solve anyone's problem. If you assume Satoshi will never sell and assume the ETFs will very rarely sell and 3.8 million Bitcoin are lost forever, that leaves 15.2 million for the rest of the world to split up. 

Of the 8 billion people on the planet, how many could buy some Bitcoin? If we guess just 2 billion people, and that is just a guess, and divide that into the 15.2 million Bitcoin, I think that works out to just under 1/100th of a Bitcoin per person, which works out to less than $100 per person at the current price.

First, is the math right based on my numbers? If so, then maybe there are better numbers to use but if I'm conceptually correct, how can Bitcoin possibly do what the touts say it will do? How can it solve anyone's problem? If everyone owned $100's worth at today's price and it went up 1000x in price, they'd own $100,000 worth. In thinking about a lifetime of spending, maybe buying a house or two otherwise paying rent, a few cars, having kids, saving for the future, $100,000 doesn't seem like it's anything and keep in mind I am assuming a 1000x gain which is a lot to rely on. The context is a lifetime of financial needs not a one shot deal. 

How many people own, more than $10,000's worth of Bitcoin? A Google search says 6.5% of Bitcoin holders own between 1/10 of a Bitcoin and 1 full Bitcoin. At just under one Bitcoin, I fall into this range. A different Google search says there are 106 million Bitcoin owners so about 7 million own between 1/10 of a Bitcoin and 1 full Bitcoin? I have no idea if any of these numbers are correct but those 7 million meaningfully skew the slightly less than $100 average we figured on above. 

All of the reasons to ascribed to what Bitcoin could possibly protect against are true for the most part related to inflation and debasement but I am having trouble seeing how Bitcoin can solve the problem.

I think it can be a productive portfolio addition betting on the asymmetry which of course argues for starting very small. From there, the decision about whether to ever trim it, rebalance it or just flat out sell it depends on the end user. I think I can stick to my plan of not selling until it grows into a life changing piece of money but we'll see. 

The above two portfolios are pretty consistent with a lot of the work we do here. SPBC owns 100% S&P 500 plus 10% in Grayscale Bitcoin Trust (GBTC) so the 10% to SPBC means 1% of that portfolio is in Bitcoin. I used BTCFX in Portfolio 2 to backtest a little further than we could with an ETF. I didn't want to backtest too far back because Bitcoin had massive gains in 2017 and 2020 that might not be repeatable. Even the gain in 2023 might not be repeatable but it's the best we can do. Portfolio 3 is just the Vanguard Balanced Index Fund (VBAIX) which is a proxy for a 60/40 portfolio and I benchmarked it to Bitcoin. 


The backtest assumes no rebalancing, letting Bitcoin succeed...or fail. The difference between Portfolios 1 and 2 is so slight that I'd say SPBC is meeting the expectation it is setting. Not all the Simplify funds are successful on this front and not all capital efficient funds are successful in this way. The portfolio stats are generally much better that VBAIX but it's hard to say whether that is more about the managed futures or TFLO than the Bitcoin exposure but it is fair to say the 1% to Bitcoin didn't hurt it. 

Finally, all the points I made arguing against Bitcoin's use case could probably be easily swatted down by the touts and true believers but man, I don't see it.  

The information, analysis and opinions expressed herein reflect our judgment and opinions as of the date of writing and are subject to change at any time without notice. They are not intended to constitute legal, tax, securities or investment advice or a recommended course of action in any given situation.

Friday, October 25, 2024

Can A 7% Yield Be Sustainable?

Yesterday I mentioned the NASDAQ 7HANDL Index ETF (HNDL) and that I wanted to take a closer look at it in a separate post. The fund launched in early 2018, I heard about the fund from someone I knew from Claymore ETFs, a name that is long gone, and was then involved in HNDL. I was skeptical that the fund could maintain its objective of a 7% payout without eroding considerably. Almost 7 years in and the fund has been paying 6-7% for the most part but the erosion is not considerable. 


It did get hit in 2022 so it might be fair to say it chugs along most of the time without the expectation of crisis alpha. It did snapback after the 2020 Pandemic Crash, that dip was smaller than the broad market.

The portfolio underlying the fund is pretty interesting if you strip out the 7% income stream which includes returns of capital (ROC). As I said yesterday, ROC is not necessarily a bad thing for tax reasons and for addressing the front burner issue of creating an income stream, realizing that there very well could be long term NAV erosion.

I built out the following that does not reinvest the dividends.


Portfolio 1 is the ETF itself. Portfolio 2 copies the holdings with a couple of tweaks to be able to backtest longer, for example instead of QQQM I used QQQ which both track the same thing. Portfolio 3 is just as it says, I removed the duration which was quite a few funds in favor of a floating rate fund with essentially no volatility. In removing the duration, I removed the volatility as opposed to trying to make a call on interest rates, the idea is just to reduce the volatility which obviously I did. 

HNDL has a similar standard deviation as the iShares 10-20 Year Treasury ETF (TLH) and about twice the standard deviation of aggregate bond ETFs. The floating rate fund has a standard deviation of 0.59% which is nothing as I said. 

HNDL's payout has been lumpier than I realized but interestingly, Portfolio 2's income appears to have been steadier than the ETF. Portfolio 3 probably has not been as steady but it's been ok. In seven full and partial years, HNDL increased in price in five years with two years of decline including a 20% drop in 2022. That obviously nets out to a slightly negative CAGR. Could you live with that from some sort of income bucket. Portfolio 2 has yielded between 3-4% every year. Is that worth it for a CAGR, after dividends, of just under 5%. What about Portfolio 3? That certainly has not provided equity-like returns but it has been decent.

HNDL has been in the same ballpark, performance wise without reinvesting the dividends as AGG and TLH and you can see the volatility profiles are consistent with what I mentioned above. Would HNDL or something else like it be useful for you? There is not single right or wrong answer. I'm not interested in using the fund but it has clearly done better than I would have expected.

There are also some interesting things in the holdings if you want to click through and look. It has a mid single-digit weighting to the JP Morgan Equity Income ETF (JEPI) which is kind of inline with what we talk about here, small weightings to these things not 30% or whatever. It also has about 7% in the WisdomTree US Efficient Core ETF (NTSX) which might be better known as the 90/60 fund. NTSX leverages up such that a 67% weight equals 100% in VBAIX leaving 33% to just earn extra interest on the cash, can be put into diversifiers to create a better risk adjusted result, go hell bent for alpha or some combo of the three. The small weighting to NTSX has the effect of leveraging up HNDL by about 3%. That is far from misusing leverage which so often leads to ruin. Maybe the exposure to NTSX helps or maybe it hurts, but that is not potentially ruinous leverage. 

The fund has been somewhat successful even if not optimal but it is useful to see someone else finding a practical use for covered call (derivative income) and capital efficient funds to help tie up a lot of the concepts we explore here. 

The information, analysis and opinions expressed herein reflect our judgment and opinions as of the date of writing and are subject to change at any time without notice. They are not intended to constitute legal, tax, securities or investment advice or a recommended course of action in any given situation.

Thursday, October 24, 2024

Annuitize, Not Annuities: Update

I had a chance to dig in a little more on the LifeX product line with a webinar on Wednesday and then a call with Stone Ridge on Thursday. These originally were mutual funds but Stone Ridge, the provider, revamped the whole line to make them more accessible, ETFs versus advisor approved funds, and to also make them simpler, that's Stone Ridge talking, maybe they're simpler or maybe not. As ETFs, they are definitely more accessible. 

As mutual funds, these seemed pretty simple. You buy the mutual fund for your birth year and then at age 80 they converted into a longevity pools that could no longer be sold. If you died at 81, then the other participants in the fund-turned-pool "won" for having your investment provide them with income and you would have "lost." I was struggling to understand the ETF version. They pretty much scrapped most of the mutual fund structure which makes the ETF format easier to understand. 

For now, they run from 2048 to 2063. Where these pay a fixed income until the year in the description, you pick the year you want the income to run through. If you buy the 2051 version, regardless of your age, you should expect it to deplete in 2051. There is more to this to learn about, follow up with LifeX if you're interested.

There is still an option to access a longevity pool. Later, but I am not sure if age 80 is relevant, you could sell the ETF and buy into the longevity pool that resembles a closed end fund. The advantage to doing this would be a higher income off the assets but the assets would stay in the longevity pool (closed end fund) after you die. 

There are two versions for each year. One version with regular treasuries that for now has a higher yield and a version with inflation protected Treasuries, TIPS. Like other funds, the income stream off the funds is partially interest earned from the holdings as well as a return of capital (ROC). ROCs are tax friendly on the front end but reduce the cost basis for when/if you sell. Returning capital is not on it's face a negative. Regardless of what you think about these funds, getting over the block that ROCs are bad would be a good hurdle to clear. 

The funds are interest rate sensitive so they are going to be volatile. The chart tracks the 2060 fund compared to iShares 7-10 Treasury (IEF) and iShares 10-20 Treasury (TLH).

The way this is countered by Stone Ridge is that it is better thought of as holding an individual bond. They say the income will be constant but that the price will fluctuate like holding an individual bond. Yes, that is the experience of holding a long term bond. They are correct that in holding it for the income until the year in the name of the fund, 2060 in the chart, the price level shouldn't matter because the holdings in the fund all mature at par. That's great unless there's an expensive emergency where you have to sell something. Selling one of these 20-30% down would be a permanent impairment of capital. 

The next chart provides some good context for how to position them.


There's a capital efficiency aspect to the idea. The inclusion of LifeX and their willingness to return capital expecting to deplete in whatever year like when a holder is 90 or 100 means the "income" can be higher than a regular bond portfolio. I don't know for a certainty these will work but knowing the company, I lean toward giving them the benefit of the doubt. The question then is, ok, good idea, is someone else doing this or something similar that is better than LifeX?

In prepping for all of this, I circled back to the NASDAQ 7 HANDL Index ETF (HNDL). I looked at this a few times when it first listed in 2018. The big idea is that it targets a 7% payout that will include ROC. I was skeptical but the fund is doing what it said for the most part. The payout has been pretty steady. The price held up pretty well in the 2020 Pandemic Crash but in 2022 it fell 19%. Since inception, Yahoo has it down 13% on a price basis. 

I think a reasonable expectation for HNDL is that it will slowly deplete and then reverse split. I think the fund has done an admirable job having so little depletion in almost seven full years. It has done better than I expected. Its seven year life has been a useful test in terms of length and for seeing it navigate through several different kinds of averse market conditions. If it will deplete at some slow rate and pay out 7%, why wouldn't you buy HNDL instead of one of the LifeX funds? I asked that question on the Thursday call. They weren't familiar with HNDL but in eyeballing HNDL's holdings they said they thought the LifeX strategy would be a more reliable income stream. Several of the LifeX funds are close to 7% now. They then talked about some sort of combo of HNDL and LifeX which might make sense for an income or annuitized (not annuity, annuitized) bucket if the LifeX funds prove out as being uncorrelated to HNDL.

Using IEF as a proxy for LifeX, the matrix below argues that an income bucket with both could be a reasonable idea for answering the correlation question. I threw in XYLD because it seems like it is in the same neighborhood, high income with a very slow depletion. 

The income stream from HNDL has been pretty solid so I'm not sure LifeX being more reliable comes into play. To be clear, they did not crap on HNDL, they just think their product is more reliable.

Occasionally, I will ask what problem a fund or strategy is trying to solve.  I think LifeX is trying to solve the right problem but I am not convinced for now that it's the best way to solve this problem but I will try to learn more about them. 

In the next post, I'm going to look closer at HNDL's composition. It looks like it has evolved over time and it is intriguing. 

The information, analysis and opinions expressed herein reflect our judgment and opinions as of the date of writing and are subject to change at any time without notice. They are not intended to constitute legal, tax, securities or investment advice or a recommended course of action in any given situation.

Tuesday, October 22, 2024

Unpredictable Alpha

Nate Geraci of the ETF Store is fond of saying "no one knows nothing" usually in the context of talking about Bitcoin but I think the sentiment also applies to the sentiment around long bonds. Here's a chart from Bespoke Investment Group.


There was a pretty wide consensus from long before the FOMC actually made that first rate cut that investors should lock into longer bonds before those rates went down and stayed down. Rates obviously did trend down and now they are trending up. 

The market seems to be pricing in fewer FOMC rate cuts in the intermediate term. Will that be correct? If they follow through with rate cuts, what will that do to longer bond rates? What rates "should" do might differ from what they will do. What if they slow down on the rate cuts? What would rates do then, keeping in mind that what rates "should" do in that scenario might differ from what they will do? 

The 40 year, one way trade for bonds has been over for a couple of years. For those couple of years, I have been banging the drum that bonds with duration have become a source of unreliable volatility.


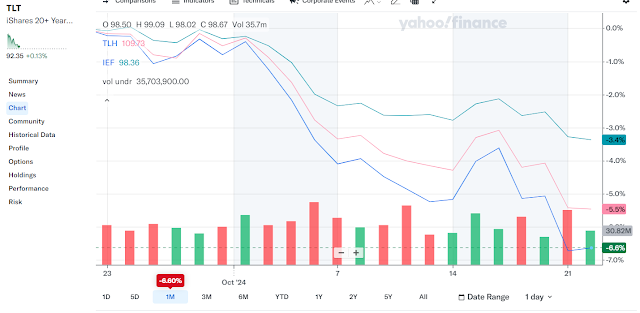
The drop in TLT over the last month is greater than one year's interest (or dividend if you own the ETF), same with TLH which tracks 10-20 year treasuries. Of course, these might come ripping back, who knows, and that is the point. 

I included the following chart in yesterday's post.

Long dated treasuries are included as being a diversifier. It turns out that TLT and TLF have no correlation to the S&P 500 for now according to Portfoliovisualizer. We've made a couple of references lately to Ray Dalio using the term Holy Grail of Investing to have 15-20 uncorrelated return streams in order to get proper diversification. The above chart has nine that are low to negatively correlated to equities and the correlations amongst the nine are mostly low or negative to each other including long  dated treasuries. 

If it makes sense to think about long dated treasuries as just another diversifier instead some sort of core building block that many people allocate 40% to, maybe something like 4-5% is feasible? I still think long bonds are a bad hold for the reasons I've said but thinking of them as just another diversifier to have a low-mid single digit weighting casts a different light. Just because 40% is a terrible idea, there will be periods where they go up and maybe one of those periods will coincide with a large decline for equities. 

The other day, I labeled global macro, certain types of long/short, risk premia and maybe even Bitcoin as You're Saying There's A Chance alts because they could go up during the next large decline, or not, there's no reliable way to know but they legitimately have a chance. Today I stumbled into a much better label from Aspect Capital via Mark Rzepczynski that in addition to global macro, certain types of long/short or risk premia and Bitcoin could include long bonds. They refer to it as unpredictability alpha. Kind of like crisis alpha, unpredictability alpha might help offset stock market volatility although calling it unpredictable alpha might make more sense. 

I still think there are far better diversifiers than long bonds but if you want to play around with long bonds, it might be difficult to backtest. They went from very predictable to being very unreliable almost instantly in late 2021.

The information, analysis and opinions expressed herein reflect our judgment and opinions as of the date of writing and are subject to change at any time without notice. They are not intended to constitute legal, tax, securities or investment advice or a recommended course of action in any given situation.

Monday, October 21, 2024

A Fascinating Hedge

A couple of quick hits today.

This chart of alternative strategies is from a webinar that the ReturnStacked guys put on last week. 


And here is a correlation matrix and you can see the order that I have the proxies listed, corresponds with the chart above.

For the most part, the correlations to the S&P 500 are quite low. Yesterday, I talked about using this screening process as a first step to exploring diversifiers. If you believe in using diversifiers, they might as well actually provide diversification. Below are some examples of commonly referenced "alternatives" that don't fit the bill in terms of reliably diversifying equity beta. 

I'm not saying these are bad funds to hold, they just don't offer too much zig when stocks zag. IGF is interesting though. In 2022 it was actually flat while in 2008 it was down more than the S&P 500. MLPs are another odd one. They did well in 2022 but did poorly in 2008. I couldn't find an apples to apples ETF that was around back then. The correlations of IGF and MLPs being high, I would not count on them to help smooth out the ride in a downturn. 

Matthew Tuttle from Tuttle Capital, an ETF provider, had an interesting comment in his daily email in the context of hedging. "13% of my risk capital is short the worst ETF ever invented (it's not ARKK and I have been sworn to secrecy on what it is)."

Respecting that he wasn't going to give up the name of the fund, I asked if it was the worst ETF because of flaws in what it tracks or a problem with the structure of the fund? His reply was that the strategy doesn't work. A fund that goes down a lot because the thing it is tracking goes down a lot is not really flawed, that's more like it's just a bad investment choice. I have suspicions that the ReturnStacked ETFs don't work for example. That will either prove out as being right or wrong but there is a difference between buying a narrow fund right before the thing it tracks goes down a lot and buying something that doesn't meet the expectation it is setting. 

The idea of hedging with something that isn't working the way it's supposed to is fascinating to me even if it goes further out on the risk spectrum, it could start working tomorrow for all we know. The idea relies on something that is not working, continuing to not work.

The information, analysis and opinions expressed herein reflect our judgment and opinions as of the date of writing and are subject to change at any time without notice. They are not intended to constitute legal, tax, securities or investment advice or a recommended course of action in any given situation.

Sunday, October 20, 2024

You're Saying There's A Chance

I had a very entertaining Sunday morning listening to a webinar about portable alpha and then reading a paper referenced in the webinar. You'll see why it was so entertaining in just a bit. The webinar was 59 minutes long with four participants and one moderator. One of the participants was Rodrigo Gordillo from ReSolve Asset Management and he is also one of the ReturnStacked guys, another was Lauren Sholder from Winton and I don't know who the other two were or who the moderator was or who put on the webinar. 

Assuming I would get a blog post out of it, I figured I could get the details after watching. I made it 54 minutes in, we then went for a hike with the dogs and then when I settled back in to watch the last five minutes, I got an error message telling me to reload the page. When I reloaded it, the webinar had disappeared as did the Tweet I saw that pointed me to the webinar. My hunch is that it got posted before a proper compliance review and was taken down. This is the link I had but again, appears to be a dead link for now. https://vimeo.com/1021091039/646ff635cd . Kind of funny, when Vimeo couldn't find the webinar, the page said VimeUhOh. 

Portable alpha in its simplest form is the strategy of blending plain vanilla beta exposures like equities and bonds in such a way where futures contracts replace one of the two, leaving cash or room to add alpha seeking strategies. The PIMCO StocksPLUS Long Duration (PSLDX) offers 100% exposure to equities and 100% exposure to long bonds. If an investor put 50% of their portfolio into PSLDX then in theory they have a 100% allocated stock and bond portfolio. That leaves 50% to put into alpha seeking strategies. 

The webinar started with some history of portable alpha. I've heard this several times but haven't relayed it here. It was a PIMCO invention in the 1980's that blew up in 2008 because practitioners were leveraging up to buy assets with equity beta. The way it's been told, the leverage was used to find stock pickers believed to be capable of outperforming the indexes. If you don't recall hearing about this in 2008 it's because it was much more of an institutional problem than a problem for retail sized accounts. 

With the experience of 2008 under the industry's belt, the conversation around portable alpha has become more about how to get more effective diversification in a capital efficient manner. Capital efficient just means leveraged. 

A key point reiterated a few different ways was the extent that the assets used for portable alpha has to be a negatively correlated to the beta assets of equities or fixed income. Otherwise, portable alpha would be taking on more risk which was the lesson of what not to do from 2008. They briefly touched on an idea we've looked at before which is to dial up or down beta based on the top down environment. We've looked at top down in terms of both qualitative factors and technical factors. The last time I added the ProShares Short S&P 500 (SH) was in September 2021 which was an example of both qualitative where it really looked like Congress was willing to endure a technical default over the debt limit and technical when the S&P 500 was more than 20% above its 200 day moving average. Adding SH in that instance allowed me to dial down the net exposure without selling anything. 

There was a consensus among the group that trend has tended to be the best answer to "porting" alpha into a portfolio. This was conveyed by the participants in a very matter of fact way, well of course managed futures is the best alternative strategy for this. Managed futures isn't the only way to do this but they seemed to be saying it was most reliable among several other alternative strategies noting that only managed futures has been consistently lowly or negatively correlated. That reiterates the idea we talk about being reliable and meeting the expectation set by a strategy/fund. The point of all of this they said is to reduce volatility while understanding that volatilities can change. Long bond volatility has changed, it has become a source of unreliable volatility as I've been saying for quite a while now.  

Then Rodrigo referenced a paper by Jason Josephiac from Meketa that sounded interesting. I have the correct spellings now but just based on his mentioning the paper, it took a while to find it on Google. The paper also lists Ryan Lobdell and Brian Dana as authors of the paper too. 

The paper explores diversifiers in almost the exact same manner as I do but with very clever descriptions. They talk about first responders, second responders and diversifiers. Here's breakdown.

What they've called First Responders, I've referred to as having a direct cause and effect. Stocks go down, they go up. This group has included BTAL, inverse index funds, long VIX (long volatility), tail risk (index put options) and they include long duration treasuries which I am saying I don't think they are reliable anymore. First Responders should "work" right away with fast declines and to a lesser extent large declines. Long volatility and tail risk might stop working during a decline if after a while, volatility compresses. VIX mostly dropped from April, 2022-August, 2022 while the S&P 500 was moving lower.

Second responders is a shorter list with managed futures obviously and I would add gold into this category but gold might be a little less reliable for this group. We've talked about the different nuances between different managed futures funds but when the trend does actually change, the strategy has tended to go up when stocks go down. I've been saying this for ages, the panelists said this too. I have confidence but do not assume infallibility. 

The Third Responder category as they have it seems pretty broad. I would divide that one in two. The group as they define it focuses on zero correlation. I would have this group just be what I've described previously as horizontal lines that tilt upward no matter what is going on. This includes various forms of arbitrage like they said, along with insurance linked securities (catastrophe bonds/risk transfer) and market neutral. Distinct from that group, I would add a category called You're Saying There's A Chance. This is where I would put things like global macro, certain types of long/short or risk premia and maybe even Bitcoin. These types of funds are legitimately uncorrelated return streams that are capable of going up a lot in a broad market decline but the reliability is not very high. Here's an example of each from 2022. They were all up a ton in 2022 but there's no great way to assess whether they could repeat that performance in the next bear market, but there is a chance...


There was one other point from the paper to touch. The concept of label masking diversification which isn't effective diversification. Here's a list of how someone might build a portfolio and think they are diversified. 

The first five rely on the same things. High yield is a pretty close cousin too and depending on the hedge funds chosen, they too could being relying on the same things meaning they could all go up together and so then they could all go down together, they all have equity beta. You also hear about infrastructure as an alternative diversifier. It's not. These things (most of the list and infrastructure) all have equity beta. You're not going to diversify equity beta with more equity beta. BTAL is the AGFiQ US Market Neutral Anti-Beta ETF. It has a negative beta, it's a First Responder. 

If First Responder, Second Responder, Diversifier and my extra category You're Saying There's A Chance helps sort all these out, good. We talk about examples from all of these groups constantly, Portfoliovisualizer has a correlation tool to perform the screening process of making sure you're looking at the right thing and then you can start to learn about the funds themselves beyond just the correlation stats. 

If you even believe in any of this, plenty of people do not, I would still focus on a lot of simplicity with beta, hedged with a little complexity. As far as portable alpha, where part of the appeal is to reduce tracking error, first you need to decide how important that really is. I am trying to smooth out the ride for clients so they can take what they need without being overly stressed by market volatility. That implies I want tracking error. If you're a do-it-yourselfer, I don't know why you would care at all about tracking error. 

And a follow up. The other day I mentioned the STKD Bitcoin & Gold ETF (BTGD) and was skeptical that it can work. It leverages up to 100% bitcoin and 100% gold. I back tested it and it showed no differentiation between just holding Bitcoin. I checked Portfoliovisualizer again and got the same long term result. The 21Shares Bytetree BOLD ETP has the same exposures as BTGD, trading in London. Here is a YTD chart from Bloomberg that does show differentiation. 


Building the chart was difficult. Yahoo recognizes the fund but it didn't chart it. When I overlayed Bitcoin on the Bloomberg chart, it was wrong, it was also wrong when I tried ProShares Bitcoin Strategy ETF (BITO) which is futures based so I couldn't get the full two years that the Bytetree fund has been trading. 

If the Bytree fund is the better representation than my backtest, then maybe BTGD will work. There are periods on that chart when Bytree moves in the same direction as the iShares S&P 500 ETF (IVV) and other periods where it goes in the opposite direction. Could BTGD turn out to be a muted proxy for Bitcoin? I don't know but that might be interesting. It needs a little more than three days to prove out. Here backtest I referenced the other day but just looking at 2024.


There's differentiation but it's not crystal clear what BTGD will actually do. Since I mentioned it above, the correlation of the 100/100 backtest to the S&P 500 shows 0.68 compared to 0.18% for just Bitcoin and 0.09% for just GLD which is worth noting.

BTAL and QGMIX are client and personal holdings. 

The information, analysis and opinions expressed herein reflect our judgment and opinions as of the date of writing and are subject to change at any time without notice. They are not intended to constitute legal, tax, securities or investment advice or a recommended course of action in any given situation.

Saturday, October 19, 2024

Should Portfolios Be Rebalanced?

Barron's had an article about rebalancing portfolios noting that the run in stocks was a good time to rebalance the equity allocation back down closer to target, whatever that might be and also rebalance down some of the relative winners. Regardless of anything to do with rebalancing, if you use a broad technology sector ETF for that exposure, it is probably close to doubling up on the S&P 500's return in that time and if you use individual stocks and were lucky (or skilled) with your picks you could be up much more in those names versus the SPX so the portfolio could very well be skewed.

There's no wrong answer about rebalancing. I'm not a huge rebalancer but it's not that I never do it. Over the years, I've trimmed here and there when holdings get too big relative to the portfolio. Quite a few years ago I trimmed down Nike (NKE) as well as GLD and more recently Novo Nordisk (NVO). This past week I sold half of a name that had a big jump on earnings that I don't think was justified. It's been a while but a few times I had names for clients that were taken over, I sell those names as soon as the news hits. Yahoo comes to mind which I sold in the pre-market when the news was announced, this was maybe 2006 or 2007 and Kinder Morgan Partners when KMI was going to absorb it back in. 

Those last three examples are less about rebalancing and more about how I think about selling. The biggest reason that I don't do a lot of rebalancing is the idea of letting winners run. I haven't phrased it that way here, the way I have talked about is to say when you look back at some stock with massive, massive gains over some 20 year period or whatever and you say to yourself "if only I'd bought and held," well that is what I am trying to capture. I've since learned that the fancy word for this is ergodicity. In this conversation, the Peter Lynch quote about rebalancing being akin to cutting the flowers and watering the weeds might be relevant too. 

When clients need money out beyond the normal cash flow needs, I might shave a little off of some biggest gainers but try to mix that up a little. In doing this for taxable accounts, there aren't really too many positions that are down which is a byproduct of holding on for a long time. I try to lessen the tax impact where I can but there's really very little offsetting available.

I put a lot of faith into the process of managing the volatility of the portfolio, not individual positions. Things like client/personal holding BTAL for my money, work for portfolio volatility which makes individual position volatility easier to cope with. Whatever you are using to get tech exposure, if you go narrower than broad based index fund, that is one source that adds volatility and probably basis points of return to your portfolio, that's why you own it. Whatever you are using to get consumer staples exposure, if you go narrower than broad based index fund, that is one source that dampens volatility and probably adds yield, that's why you own it. 

Diversifiers like BTAL aren't the ones that are going to be 900% in 15 years or compound at 10% like the S&P 500. It makes sense to me to adjust the exposures to those ocassioanlly than to rebalance in the more common use of the word just for the sake of rebalancing. 

The comments were of course worth reading. Always read the comments. There were some comments that agreed with the article's premise about rebalancing but more that disagreed for varying reasons. There was the usual distrust of financial advisors added in. One comment against rebalancing from a guy who comments every article, maybe literally every article, said he put $25,000 into Microsoft a long time ago, never sold and now it's worth one point something million. He was candid though in mentioned that he never sold Worldcom or Enron but obviously Microsoft more than made up for it. 

Not rebalancing just for rebalancing's sake or as some skeptical comments said, for advisors who think they need to do justify whatever, is one thing but no process for selling isn't great either. There is a balance to this point. 


Names aren't important here. These are two stocks that do mostly the same thing. A third name declared bankruptcy and its stock went private in a take under so to speak. The blue line looks like it could be in serious trouble, maybe some sort of distressed buyer would take a stab down 86% but I don't know the story well enough to know if that makes sense. The pink line supports the idea that the group is going through some rough times and pretty much it can be replaced for daily living by Amazon. 

Nike, is a name I've held for clients since about 2006. It's had a nasty drawdown that looks like it bottomed at $70, it's at $83 now. It has had some sharp downturns over the years but this one is the biggest. If I am totally wrong about Nike coming back, the way the last two years have gone, it's sort of self-corrected down in the portfolio. I'm not yet at the point of adding to the position and not sure when or if I will but Elliott Hill coming back makes me confident that the decline is over unless something hideous happens from the top down like the S&P 500 dropping 30-40%. All of that notwithstanding, I could just end up being wrong. If you go narrower than a broad index fund, you will get some decisions correct but will be wrong about others. 

There was also my favorite type of comment on the article too.

Just buy SCHD reinvest all dividends and go for a hike for 30 years.

We see these types of comments occasionally and they really stick with me for whatever reason. SCHD is the Schwab US Dividend Equity ETF. I'm not going to bag on SCHD but there are some things to consider any time someone says put it all into such and such and forget it.


The chart compares SCHD to VOO and dividends are not reinvested. I took the comment to mean put it into SCHD and live in retirement off the dividends (and Social Security too). Going back ten years, and assuming the dividends are spent, the SCHD position is smaller by about $7300. SCHD's standard deviation is lower by 49 basis points but it compounded lower by 315 basis points. The dividends paid out over 10 years per Portfoliovisualizer was $4893 versus $2866 from VOO. 

So, $4893 of income per $10,000 invested. An investor with $1 million in SCHD would have made $489,300 over ten years. But that's not quite right. Dividends are taxed in ordinary income rates. What bracket might this person be in? 12%, 22%, 24%? Those three cover most people. So $489,300 becomes $430,584, $381,654 or $371,868 for most people. Long term capital gains are taxed at lower rates. If your income is taxed at 12% it is likely that your long term capital gains rate is zero. If your tax bracket is 22% or 24% then chances are your long term capital gains rate would be 15%.

In many instances, it would be more tax efficient to sell shares than to live off of dividends. If you are pulling from an IRA, you are paying ordinary income rates on those withdrawals so if you put it all into SCHD in your IRA, then you would be giving up 315 basis points per year (looking back obviously) but your volatility would not be much lower. I'm not sure put it all into SCHD is a good call. 

What about if you're in some sort of game over mode? SCHD did offer a lot of crisis alpha in 2022 but the volatility is pretty high for all the return you'd be giving up. There are better ways to build out a portfolio that points to some variation of "game over." 

That's not to say that there isn't a place for the attributes that SCHD might bring to a portfolio. If you can figure out some sort of blend. Is this compelling?

It outperforms market cap weighted with a slightly lower standard deviation and a little more yield. It's incremental but was the worst performer of those three only one time in the 10 full and partial years studied. 

The information, analysis and opinions expressed herein reflect our judgment and opinions as of the date of writing and are subject to change at any time without notice. They are not intended to constitute legal, tax, securities or investment advice or a recommended course of action in any given situation.

Thursday, October 17, 2024

What's Wrong With Managed Futures?

A very long running theme to my writing going back almost to the beginning has been to avoid allocating too much to specific diversifiers. We've talked about this in relation to MLPs. gold and REITs going back 18 or 19 years and more recently we've talked about what a bad idea a 20 or 25% weighting to managed futures is. The behavior carried forward from REITs and the others to managed futures maybe a year or year and a half ago with a lot of content pointing to huge allocations to managed futures.

I wrote a similar post along these lines recently. There a couple more recent points we can add in to this discussion. First was Corey Hoffstein cowrote a paper that he gave a TLDR version on Twitter that appeared to be in support of managed futures replication which is typically how ETFs put on the strategy. The mutual fund wrapper is more amenable to full implementation. The takeaway for me was the potential performance dispersion across different funds. If you have interest in the space and maybe monitor a few funds you'll notice day to day differences of course and those differences can be pretty big over longer periods.

The differences are a little more nuanced than being long or short some currency or commodity. The differences often relate to different forms of risk weighting, the extent to which a strategy might use any faster signals for positioning and how the fund handles it when a 10 month signal conflicts with a 30 day signal as some examples. Here are four different managed futures mutual funds going back five years.


There are some distortions from how Yahoo handles year end distributions which were big at the end of 2022. The dispersion among the four is pretty wide but they all worked when investors needed them to work in 2022. Now check out the five year period below.


Would you have wanted 25% of your account in managed futures in that run? Research that concludes 25% into managed futures is overly academic, IMO, for real world implementation. I'm saying this as someone that has been a true believe for more than 15 years. 

I don't think a five year run like the one above is going to be repeated anytime soon but as a group, they could easily languish for a long time. A "permanent" low-mid single digit weighting would merely be a drag on returns but a 20-25% weighting could be a real problem. 

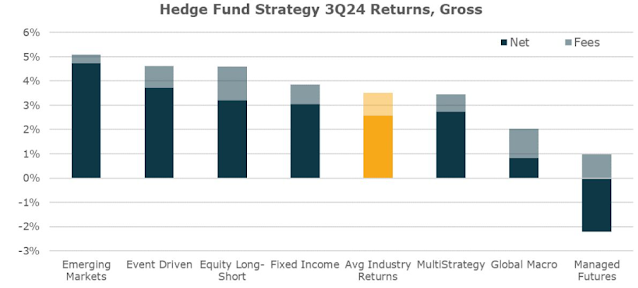
This bar chart comes from Bob Elliott and Unlimited Funds.

That's a lot of alternative strategies that did well in the third quarter with one that did poorly. I always say that no strategy can always be best and I should add that every strategy will take a turn being worst. By Bob's work, managed futures were down a little over 2% in the third quarter while the S&P 500 was up 4%. Repeating what I said frequently back when managed futures was struggling, it was doing what it was supposed to. Managed futures tends to have a negative correlation to equities so if equities go up, it should not be a surprise if managed futures go down. Managed futures can of course go up with equities but I would not expect it do so. 

The next time there is some sort of stock market calamity, not a crash but more like a bear market sort of event, my guess is that futures will do well and again bring out the put 25% into managed futures crowd. Assuming you do not want to be in the business of guessing when managed futures will have a great run, think of the strategy as a way to diversify volatility in the thing that will provide the most growth which of course is equities. In that light, a small allocation will make much more sense. 


An exception to quite a few of the "rules" we talk about is the Standpoint Multi-Asset Fund (BLNDX) which is a client at personal holding. It blends equities and managed futures in search of an all-weather result and for my money it delivers that result very consistently. Yes, ReturnStacked Stocks and Managed Futures (RSST) does something similar but they have different goals, they set different expectations and for my money, literally, it does a much better job of meeting the expectation they set than RSST. Even still, the exposure to BLNDX is nowhere close to 20-25%. 

I think there is a vanity aspect to putting so much into managed futures. It is a sophisticated strategy that is intellectually appealing and plays to your ego. It's ok to feel that emotion but the point is to not succumb to that emotion. Diversify your diversifiers because Q3, 2024 will not be the last time managed futures lags the other alternatives. 

The information, analysis and opinions expressed herein reflect our judgment and opinions as of the date of writing and are subject to change at any time without notice. They are not intended to constitute legal, tax, securities or investment advice or a recommended course of action in any given situation.

Cash vs Bonds

Barron's looked at the merits of holding cash versus bonds which fits in here very well. The article was fine for the most part. It gen...